Spurious Correlations and Ratios

August 24th, 2012

Kronmal, Richard A. (1993) „Spurious Correlation and the Fallacy of the Ratio Standard Revisited“, Journal of the Royal Statistical Society. Series A (Statistics in Society), 156 (3), pp. 379-392.

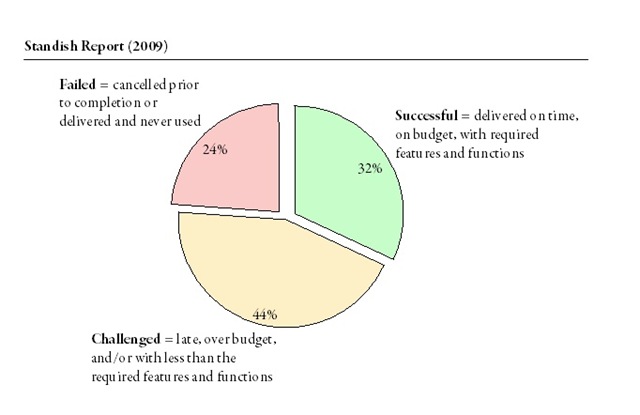
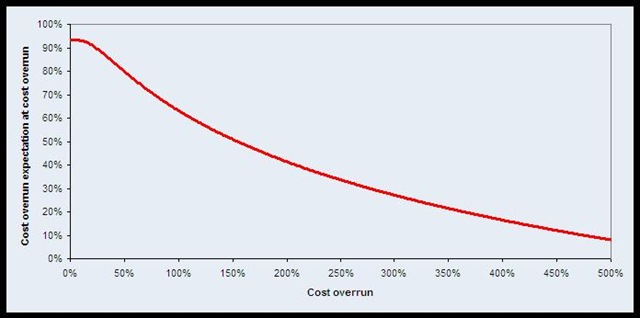
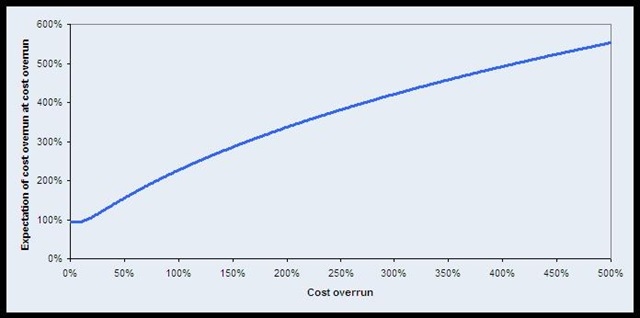
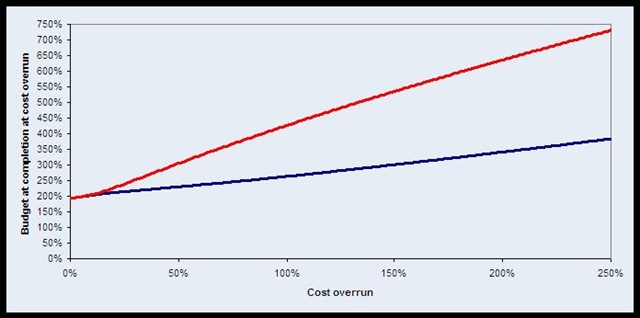
This has been on my mind for a while. A lot of our research uses looks at cost overruns as the variable to measure the project performance. More precisely we most often use Actual/Estimated Cost – 1 to derive a figure for the cost overrun. A project that was budgeted for 100 and comes in at 120 thus has +20% cost overrun. If the scale needs to be transformed, which in most cases it does, the simple Actual/Estimated ratio offers some advantages, i.e., figures being non-negative.

Most criticism for this comes from the corner of Atkinson (1999)*, i.e., that the holding the project accountable for its initial Cost-Benefit-Analysis (+Time) is an unfairly narrow view that ignores the value of building stuff itself, the wider and possibly non-quantitative benefits for the organisation and the wider and most likely non-quantitative benefits for the stakeholder community.

However, a second corner of critics has also a powerful argument. Ratios cause all sorts of statistical headaches. First, dividing a normally distributed variable by another normally distributed variable creates a log-normal distributed variable, i.e., it creates outliers that are solely an artefact of the ratios.

More importantly than distributional concerns are spurious correlations. This is an example from the article

„… a fictitious friend of Neyman (1952), in an empirical attempt to verify the theory that storks bring babies, computed the correlation of the number of storks per 10000 women to the number of babies per 10000 women in a sample of counties. He found a highly statistically significant correlation and cautiously concluded that ‚. . . although there is no evidence of storks actually bringing babies, there is overwhelminge videncet hat, by some mysteriousp rocess, they influencet he birth rate‘!“ (Kronmal 1993:379)

What happened in that example. The regression should have been the test of the number of storks and the number of babies in a county. The argument for the ratio is that it will control for the number of women in the county. The argument against it is that that creates a spurious correlation. Better would be an ANCOVA type structure. Or as the article puts it

„This example exemplifies the problem encountered when the dependent variable is a ratio. Even though Y, the numerator of the ratio, is uncorrelated with X, the independent variable, conditional on Z, the ratio is significantly correlated to X through its relationship to Z, the denominator of the ratio.“ (Kronmal 1993:386)

Three more observations are made in the article

  1. Using the two variables and their interactions instead of a ratio commonly makes for a worse model than using the ratio, particularly in stepwise regression models.
  2. Ratios are an interaction and can only be adequately interpreted in an equation that includes both of these variables (the main effects)
  3. Use a full regression model with interactions, then include the ratio if it adds to it

The final advice is

But what if the ratio is the ’natural quantity of interest‘, just like in our performance measurement?

The division of the outcome by the estimate is to remove its effect from the numerator variable. Kronmal questions whether „this is the optimal way to accomplish this“. He goes on further „…even when such rates are used, there is no reason not to include the reciprocal of the population size as a covariate. For other ratios, the purpose of the denominator is usually to adjust for it. In these instances, there is little to commend the use of this method of adjustment.“ (Kronmal 1993:391)

I will think about this a while, get in touch if you want to share thoughts on this.

* Atkinson, Roger (1999) „Project management: cost, time and quality, two best guesses and a phenomenon, its time to accept other success criteria“, International Journal of Project Management, 17 (6), pp. 337-342.

How to write a good essay

August 8th, 2012

Yesterday at lunch I had a discussion with two of our MSc students on how to write. We started of on how to write a good thesis and ended up talking about how to write a good essay. This morning I got an e-mail from the Chair of the Examiners, who is the person running a committee that decides the marks for student work.

N.B. marking in Oxford is its own case study of accountability, transparency, and power. I don’t understand how such an intricate system has evolved that relies on double-blind processes combined with committee decisions and multiple-levels of hierarchy to quality control all to derive ‚objective‘ marks while the revelation that facts are constructed came to this institution as a big surprise.

The email I got this morning asked me to give some students feedback on one of their essays. I have to admit switching from communication by powerpoint to communication via unformatted, double-spaced, prose was one of the greatest challenges of starting with this DPhil. I also just read Dan Ariely’s brilliant blog post and the subsequent op-ed in the LA Times on this topic.

Drum roll. Here is my list on ‚How not to write you essay

  1. Answer a different question. Well, why wouldn’t you. Time is short, the deadline looms. Luckily, in this other course there was a required reading, which you still remember and which could shine some new light on the question. Brilliant idea! Of course there are bonus points to be earned for bringing in new literature. This is perfect murder of two birds with one stone. Unfortunately the execution often falls through. The argument, already a basket case full of apples and oranges, doesn’t get the cream and chocolate sprinkles on top, which it deserves but rather gets a completely new addition, which looks more like a block of cheese with a smell of old socks rather than a fresh idea.
  2. Look up the etymology of the key concepts. No argument has ever been advanced by looking up the etymology, well outside the realm etymologists anyways. It is always good to know that the word project can be traced back to 1450. Always good way to use space.
  3. Give good solid definitions for all concepts. A good essay ought to start with a long laundry list of working definitions for key concepts. Let’s define risk, organisations, bias, projects, and my favourite major programmes. Once that is out of the way we can actually start looking at the question. Again a great way to use the space.
  4. Write up the lecture slides. Just on the off-chance that the marker hasn’t read the slides, just copy them and expand the text a little. Did you make a recording of the lecture. Even better. Easy peasy lemon squeezy.
  5. Cover everything that has been touched upon in class. Decision-making is hard, to decide what concepts to use and which ones to ignore is risky. Avoid cutting something out whenever possible. On the flip side if you cut something out you should not talk about why you took a specific lens.
  6. Make shit up. Drop names. I do have 10 years of experience in this, so let me tell you what I think. I think that the following 8 factors are the key to success in the field. Also, since it is my own opinion I don’t need to add references. Time saved! Damn, they want a reference. Let’s just put an article here whose title sounds as if they would agree with my thinking. Done!
  7. Be Malcom Gladwell „A cursory reading of 5 journal articles has brought me here today to tell you…“

My list for a good essay

  1. 1 idea per paragraph, first sentence explains how this is important to answer the question, last sentence gives the so what? and answers the question. Sounds simple, then go on and do it!

My background is in Computer Science and my old prof Eric Schoop introduced me to information mapping most essays I have to read would certainly benefit from bringing stronger principles to writing.

Success Factors in IT Projects (Fortune & White 2006 and Nasir & Sahibuddin 2011)

Juli 26th, 2012

Fortune, J. & White, D., 2006. Framing of project critical success factors by a systems model. International Journal of Project Management, 24(1), pp.53-65. Available at: http://linkinghub.elsevier.com/retrieve/pii/S0263786305000876.

Nasir, N.H.M. & Sahibuddin, S., 2011. Critical success factors for software projects : A comparative study. Scientific Research and Essays, 6(10), pp.2174-2186.

I have come across many bits of work in progress now that try to make a selection of what are the success factors in IT projects. Well, these two articles of note publish a fairly comprehensive literature review that spans the plethora of studies on this topic. Fortune & White reviewed 63 articles in total, Nasir & Sahibuddin 43. The first one includes also reviews of hard to find conference papers and case studies that have not made it on the web yet, so the details of some of these studies are hard to verify.

Here is a google spreadsheet with the key comparison between what are the success factors in both reviews ordered by the amount of evidence the authors found to support each factor.

Link to the spreadsheet

Research Featured in Harvard Business Review

Juli 26th, 2012

After 2 years of researching ICT projects the on-going research has been picked up by the Harvard Business Review and is on the cover of their September 2011 issue.

„Why your IT projects may be riskier than you think?“

By now, I collected a database of nearly 1,500 IT projects – in short we argue that the numbers in the hotly debated Standish Report are wrong, but their critics don’t get it quite right either. We found that while IT projects perform reasonably well on average the risk distribution has very fat tails in which a lot of Black Swan Events hide. 1 in 6 IT projects turned into a Black Swan – an event that can take down companies and cost executives their jobs.

Enjoy the read!

More background reading on the HBR article can be found in this working paper.

Most activity of this blog has shifted

September 8th, 2010

It was in the air for some time and then I read it in wired and last week in the Economist, the face of the web is changing once again. WWW becoming the less dominant force. Well, I used gopher:// when I was little and the university’s library still offers telnet access.Times are changing and I now write mostly at: http://www.facebook.com/pages/Oxfords-BT-Centre-for-Major-Programme-Management/122182117824942 Looking forward to seeing you there! -Alex

Standish Chaos Report 2009

April 28th, 2009

Standish 2009

The Standish Group just published their new findings from the 2009 CHAOS report on how well projects are doing.  This years figures show that 32% of all projects are successful, 44% challenged, and 24% fail.  As the website says startling results especially that they still do not hold up to scientific standards and replications of this survey (e.g. Sauer, Gemino & Reich) find exactly the opposite picture.

Integrating the change program with the parent organization (Lehtonen & Martinsuo, 2009)

April 28th, 2009

DSC02128

Lehtonen, Päivi; Martinsuo, Miia: Integrating the change program with the parent organization; in: International Journal of Project Management, Vol. 27 (2009), No. 2, pp. 154-165.
http://dx.doi.org/10.1016/j.ijproman.2008.09.002


Lehtonen & Martinsuo analyse the boundary spanning activities of change programmes.  They find five different types of organisational integration – internal integration 1a) in the programme, 1b) in the organisation; external integration 2a) in the organisation, 2b) in the programme, and 3) between programme and parent organisation.

Furthermore they identify mechanisms of integration on these various levels.  These mechanisms are

  Mechanism of integration
Structure & Control Steering groups, responsibility of line managers
Goal & content link Programme is part of larger strategic change initiative
People links Cross-functional core team, part-time team members who stay in local departments
Scheduling & Planning links Planning, project management, budgeting, reporting
Isolation Abandon standard corporate steering group, split between HQ and branch roll-out


Among most common are four types of boundary spanning activities – (1) Information Scout, (2) Ambassador, (3) Boundary Shaping, and (4) Isolation.  Firstly, information scouting is done via workshops, interviews, questionnaire, data requests &c.  Secondly, the project ambassador presents the programme in internal forums, focuses on quick wins and show cases them, publishes about the project in HR magazines &c.  Thirdly, the boundary shaping is done by negotiations of scope and resources, and by defining responsibilities.  Fourthly, isolation typically takes place through withholding information, establishing a separate work/team/programme culture, planning inside; basically by gate keeping and blocking.   

Web 2.0 what is it really about

April 27th, 2009

DSC02124

This is beautiful, and done by some very clever colleagues of mine.  It is thought provoking and you since a lot of people out there run wild for ‚2.0‘ postfixes to whatever they do; this is the ultimate checklist.  It is in essence what Jeff Jarvis wrote in What would Google do? although only few people like the book and I have not even started reading it.

Orthodoxies New freedoms Example
Role of companies and customers are distinct Customers are integral part of the operations customers as designers, customers as clerks
Companies size gives them an edge over individuals Access to better information and cheaper communications reduce advantage of size Newspapers vs. blogs
Competitive advantage derives from control over unique asset Orchestration trumps ownership Linux, wikipedia
Hierarchies are best organising framework Reduced cost of information and communication enable adaptive, loosely coupled organisations Open Source
Business processes are batch-driven Continuous information flow drives operations to resemble continuous processes Services
The best people trust their gut Data ubiquity reduces subjectivity Google
You pay for what you get Consumers get valuable services for free ("Free is a better price than cheap") Music, Google Aps
Fat tails, short tails Long tails can be served and offer attractive margins amazon

Failure at the Speed of Light (Hickerson, 2006)

April 25th, 2009

[Hot stuff! Not because it is fresh or hot of the press, no but surprisingly "Failed Projects" is the most read category on this blog this year with more than 700 readers, runner-up is "Critical Success Factors" and it is catching up quickly. ]

DSC02123

Hickerson, Thomas B.: Failure at the Speed of Light – Project Escalation and De-escalation in the Software Industry, Master of Arts in Law and Diplomacy Thesis, Tufts University, Medford, Massachusetts, 2006.
http://fletcher.tufts.edu/research/2006/Hickerson.pdf


Hickerson analyses three case studies – (1) California’s Department of Social Securities implementation of the California Automated Child Support System (CACSS), (2) Denver International Airport, and (3) FBI’s Virtual Case File.

Firstly, CACSS was planned and started in 1992, the tender went to Lockheed Martin for $75m with a go-live in December 1995.  The whole project was cancelled in 1997 after direct expenses of $100m were incurred.  A new version of the system started development in 2000 and finally went live in June 2008 (see this news snippet) and it is online here.

Second case is the Denver International Baggage Handling system.  This case is infamous to the extend that it made it on wikipedia, the full GAO report can be found here.  In short: BAE won the tender for $193m.  The system development had so many problems that in order to open the airport an alternative manual handling system was installed, which came at a price ticket of only $51m; at the time of opening the airport (Feb 1995, 2 years behind schedule anyway) the delays caused by the baggage handling system were estimated to be $360m.  Before United axed the system it cost about $1m per month in maintenance.

Third case is the FBI’s Virtual Case File.  The project started in 2001, quickly reached the typical 90% complete.  After 4 years the solution was replaced by a commercial off the shelf software and another 3 months later the project was cancelled altogether after $607m were spent.


Drawing from Social Justification Theory, Agency Theory, Approach Avoidance Theory Hickerson argues that ‚Internal inadequacies in dealing with external threats‘ was the main reason for the failures.  In case of DIA some project factors contributed to the failure such as the investment character of the project, long-term pay-offs, large size of the pay-offs, resources seen as plentiful, setbacks seen as secondary.

Apart from project factors psychological factors contributed to the failure of these cases, e.g., personal responsibility, ego importance, prior success and reinforcement, irreversibility of prior expenditures.  Thirdly social factors were responsible, such as the responsibility for failure, norms for consistency, hero effects, public identification with the course of action, and job insecurity.  Fourthly, structural factors played a role, e.g., political support, institutionalisation, and bureaucracy.


What were the tipping points that tipped the projects into escalation?

  • Change in top management support
  • External shocks to the organisation
  • Change in project champion
  • Organisational tolerance for failure
  • Presence of publicly stated resources
  • Alternate use of funds
  • Awareness of problems
  • Visibility of costs
  • Clarity of failure & success criteria
  • Organisational procedures of decision-making
  • Regular evaluation of projects
  • Separation of responsibility for approving and evaluation projects

What needs to be done to prevent escalation?

  1. Strict timeline
  2. Clear acceptance criteria
  3. Daily meetings between CIO and Managers
  4. Adherence to baseline requirements

The influence of checklists and roles on software practitioner risk perception and decision-making (Keil et al., 2008)

April 24th, 2009

DSC02122

Keil, Mark; Li, Lei; Mathiassen, Lars;  Zheng, Guangzhi: The influence of checklists and roles on software practitioner risk perception and decision-making; in: Journal of Systems and Software, Vol. 81 (2008), No. 6, pp. 908-919.
http://dx.doi.org/10.1016/j.jss.2007.07.035 

In this paper the authors present the results of 128 role plays they conducted with software practitioners.  These role plays analysed the influence of checklists on the risk perception and decision-making.  The authors also controlled for the role of the participant, whether he/she was an insider = project manager or an outsider = consultant.  They found the role having no effect on the risks identified.

Keil et al. created a risk checklist based on the software risk model which was first conceptualised by Wallace et al. This model distinguishes 6 different risks – (1) Team, (2) Organisational environment, (3) Requirements, (4) Planning and control, (5) User, (6) Complexity. 
In their role plays the authors found that checklists have a significant influence on the number of risks identified. However the number of risks does not influence the decision-making.  Decision-making is influenced by the fact whether the participants have identified some key risks or not.  Therefore the risk checklists can influence the salience of the risks, i.e., whether they are perceived or not, but it does not influence the decision-making.

Managing the development of large software systems (Royce, 1970)

April 23rd, 2009

DSC02121

Royce, W. Winston: Managing the development of large software systems; in: Proceedings of IEEE Wescon (1970), pp. 382-338.
http://leadinganswers.typepad.com/leading_answers/files/original_waterfall_paper_winston_royce.pdf

It’s never to late to start reading a classic.  This is one for sure.  The original paper which proposes the waterfall software development model.  This is now extremely common place – but and that is what stroke me odd as well, the model shows a huge number of feedback loops which typically are omitted.

The steps of the original waterfall are as follows

  1. System Requirements
  2. Software Requirements
  3. Preliminary Program Design which includes the preliminary software review
  4. Analysis
  5. Program Design which includes several critical software reviews
  6. Coding
  7. Testing which includes the final software review
  8. Operations

Among the interesting loops in this model is the big feedback from testing into program design and from program design into software requirements.  By no means can is this model what we commonly assume to be a waterfall process – there are no frozen requirements, no clear cut steps without any looking back.  This is much more RUP or AGILE or whatever you want to call it than the waterfall model I have in my head.

The resource allocation syndrome (Engwall & Jerbant, 2003)

April 22nd, 2009

DSC02120

Engwall, Mats; Jerbant, Anna: The resource allocation syndrome – the prime challenge of multi-project management?; in: International Journal of Project Management, Vol. 21 (2003), No. 6, pp. 403-409.
http://dx.doi.org/10.1016/S0263-7863(02)00113-8

Engwall & Jerbant analyse the nature of organisations, whose operations are mostly carried out as simultaneous or successive projects. By studying a couple of qualitative cases the authors try to answer why the resource allocation syndrome is the number one issue for multi-project management and which underlying mechanisms are behind this phenomenon.

The resource allocation syndrome is at the heart of operational problems in multi-project management, it’s called syndrome because multi-project management is mainly obsessed with front-end allocation of resources.  This shows in the main characteristics: projects have interdependencies and typically lack resources; management is concerned with priority setting and resources re-allocation; competition arises between the projects; management focuses on short term problem solving.

The root causes for these syndromes can be found on both the demand and the supply side.  On the demand side the two root causes identified are the effect of failing projects on the schedule, the authors observed that project delay causes after-the-fact prioritisation and thus makes management re-active and rather unhelpful; and secondly over commitment cripples the multi-project-management.

On the supply side the problems are caused by management accounting systems, in this case the inability to properly record all resources and projects; and effect of opportunistic management behaviour, especially grabbing and booking good people before they are needed just to have them on the project.

Human Effort Dynamics and Schedule Risk Analysis (Barseghyan, 2009)

April 21st, 2009

DSC02127

Barseghyan, Pavel: Human Effort Dynamics and Schedule Risk Analysis; in:  PM World Today, Vol. 11(2009), No. 3.
http://www.pmforum.org/library/papers/2009/PDFs/mar/Human-Effort-Dynamics-and-Schedule-Risk-Analysis.pdf

Barseghyan researched extensively the human dynamics within project work.  He has formulated a system of intricate mathematics quite similar to Boyle’s law and the other gas laws.  He establishes a simple set of formulas to schedule the work of software developers.

T = Time, E = Effort, P = Productivity, S = Size, and D = Difficulty
Then W = E * P = T * P = S * D, and thus T = S*D/P

But and now it gets tricky S~D~P are correlated!

The author has collected enough data to show the typical curves between Difficulty –> Duration and Difficulty –> Productivity.  To schedule and synchronise two tasks the D/P ratio has to be constant between these two tasks.


Barseghyan then continues to explore the details between Difficulty and Duration.  He argues that the common notion of bell-shaped distributions is flawed because of the non linear relationship between Difficulty –> Duration  [note that his curves have a segment of linearity followed by some exponential part.  If the Difficulty bell curve is transformed into the Diffculty–>Duration probability function using that non-linear transformation formula it looses is normality and results in a fat-tail distribution.  Therefore Barseghyan argues, the notion of using bell-shaped curves in planning is wrong.  

Please Vote – Projects: Living People or Black Swans?

April 19th, 2009

Everyone, please vote which approach you think is right.  Let me outline that for you.

Yesterday I read the Black Swan by Nassim Nicholas Taleb.  It is a great book.  In short it is about our (as in the human mankind) inability to predict rare events.  He details a lot of psychological reasons, e.g., tunneling, narrative fallacy; for us not being able to predict these Black Swans and he also shows what we can do about it.  Great book – highly recommended.  Anyway, yesterday I was reading page 159 (for the ones who have a copy handy); and there he makes the hypothetical argument that we think about project deadlines as if they were probabilistically the same as our life expectancy – partly because that’s how we evolved.  So what do you think – is that really true?  But let’s understand that distinction in detail first.

1) Living People

Life expectancy figures are the very centre of an actuary’s daily life, at least the ones who insure health and life &c.  When you meet one at a party you’ll understand how exciting this topic can be.  What life expectancy figures do is to look at the dying age distribution with in a population; ages are ordered neatly by age and then the actuaries compute the probability of dying before your next birthday.  That also gives you then an expected age which is the year by which 50% of your fellow birthday-boys and girls will be dead.  The expected age is per definition an average. 

If you look up the tables and they chart quite nicely as well (cf. the graph below) you’ll see that in 2004 in the US the expected age for a newborn is 77.8 years.  Some of them die (a saddening 680 that is) before they reach their first birthday. So if you made it there then you can expect to live for another 77.4 years which allows you to expect your death shortly after your 78th birthday.  When you turn 30 then you can expect to live for 49.3 more years (or 79.3 in total), when you reach 50 you could expect another 30.9 years (80.9 in total) and so on. 

cdc

Source: CDC Life table for the total population:  United States, 2004

What if project delays would be like a living population?

In the book Taleb argues that we typically think of project delays having the same probabilistic properties as life expectancy curves.  That is on average all projects are delayed by 3 weeks, and when a project is delayed by 2 weeks it will be delayed by an additional 1.5 weeks and so on.  Since I don’t have nice raw data and my own data pool is not yet big enough for nice analysis like that, once again I plundered the cost overrun figures from the Standish Group report.  When computed and charted it looks like this:

projects

What does it say?  Well, when the project is still immaculate with 0% cost overrun, you would expect it to overrun its budget by +98%.  If your project already shows a budget overrun of 100% it will need another +63% (so in total it will be +163%), if it has overrun its budget by +300% you would put aside another +27% (totaling it at +327%) and so on.

2) The Black Swan

So what are these Black Swans all about?  An excerpt from the McKinsey Quarterly (No. 1, 2009) where the author summarises his central thesis beautifully (cf. the full article here):

Before Europeans discovered Australia, we had no reason to believe that swans could be any other color but white. But they discovered Australia, saw black swans, and revised their beliefs. My idea in The Black Swan is to make people think of the unknown and of the potency of the unknown, particularly a certain class of events that you can’t imagine but can cost you a lot: rare but high-impact events.

So my black swan doesn’t have feathers. My black swan is an event with three properties. Number one, its probability is low, based on past knowledge. Two, although its probability is low, when it happens it has a massive impact. And three, people don’t see it coming before the fact, but after the fact, everybody saw it coming. So it’s prospectively unpredictable but retrospectively predictable.

Now that we’re in this financial crisis, for example, everybody saw it coming. But did they own bank stocks? Yes, they did. In other words, they say that they saw it coming because they had some thoughts in the shower about this possibility—not because they truly took measures to protect themselves from it.

Now, a black swan can be a negative event like a banking crisis. It also can be positive: inventing new technology, making new discoveries, meeting your mate, writing a best seller, or developing a cure for cancer, baldness, or bad breath. In The Black Swan, I say that in the historical and socioeconomic domain, black swans are everything. If you ignore black swans, you’ve got nothing. And I showed that the computer, the Internet, and the laser—three recent technological black swans—came out of nowhere. We didn’t know what they were, and when we had them right before our eyes we didn’t know what to do with them. The Internet was not built as something to help people communicate in chat rooms; it was a military application and it evolved.

So these things have a life of their own. You cannot predict a black swan. We also have some psychological blindness to black swans. We don’t understand them, because, genetically, we did not evolve in an environment where there were a lot of black swans. It’s not part of our intuition.

In the book The Black Swan he argues on page 159 that when we make predictions of project schedules we tend to make them without looking for external events.  In his example of a publishing deadline – it may be the sick grandmother, sudden financial troubles which force the author to take on a night shift job, or a terrorist attack that troubles your mind for some months.  These things happen, yet we never acknowledge them in the first place.  So he argues a project that is late by 3 months should be expected to be late by another 5 weeks, if it then is not ready after 5 months you would expect another 6 weeks, at a year delay you would rather expect it to be delayed another 5 years than expecting it to be ready within the next 2 weeks – he argues that in reality the marginal expected project delay increases and does not decrease.

So, if we go ahead and compute the same Standish Figures with these probabilistic assumptions then we get the following picture:

projects2

So what do these numbers tell us?  Well, if the project is in budget, we better expect +98% budget overrun.  If it however is +100% over budget you better expect +226% more (that is a +326% total budget overrun); and when you get there at +326% you would expect +441% additional costs adding up to a whooping +767%.  You get the idea.

So if we chart that as "expectation of total budget at completion at cost overrun of"-diagram the curves look like that:

bac


3) Your turn – the vote

What do you think is true for Projects – do cost overruns of projects show probabilistic features of living people or are they Black Swans?

Online Surveys & Market Research

Thanks. 

The Definite List of Project Management Methodologies

Januar 16th, 2009

This is a gem.
Craig Brown from the ‚Better Projects‘-Blog (here) created a presentation on Jurgen Appelo’s Definite List of Project Management Methodologies.  Jurgen published his list first in his blog over at noop.nl and now moved it into a Google Knol here.  Craig put it into a great tongue in cheek presentation.  I very much enjoyed it, as such here it is:

Software Project Methods

View SlideShare presentation or Upload your own. (tags: software agile)

Understanding software project risk – a cluster analysis (Wallace et al., 2004)

Januar 14th, 2009

DSC01461

Wallace, Linda; Keil, Mark; Rai, Arun: Understanding software project risk – a cluster analysis; in: Information & Management, Vol. 42 (2004), pp. 115–125.

Wallace et al. conducted a survey among 507 software project managers worldwide.  They tested a vast set of risks and tried to group these risks into 3 clusters of projects: high, medium, and low risk projects. 

The authors assumed 6 dimensions of software project risks –

  1. Team risk – turnover of staff, ramp-up time; lack of knowledge, cooperation, and motivation
  2. Organisational environment risk – politics, stability of organisation, management support
  3. Requirement risk – changes in requirements, incorrect and unclear requirements, and ambiguity
  4. Planning and control risk – unrealistic budgets, schedules; lack of visible milestones
  5. User risk – lack of user involvement, resistance by users
  6. Complexity risk – new technology, automating complex processes, tight coupling

Wallace et al. showed two interesting findings.  Firstly, the overall project risk is directly correlated to the project performance – the higher the risk the lower the performance!  Secondly, they found that even low risk projects have a high complexity risk.

Understanding the Nature and Extent of IS Project Escalation (Keil & Mann, 1997)

Januar 13th, 2009

DSC01460

Keil, Mark; Mann, Joan: Understanding the Nature and Extent of IS Project Escalation – Results from a Survey of IS Audit and Control Professionals; in: Proceedings of The Thirtieth Annual Hawaii International Conference on System Sciences, 1997.

"Many runaway IS projects represent what can be described as continued commitment to a failing course of action, or "escalation" as it is called in management literature."  Keil & Mann argue that escalation of projects can be explained with four different factors – (1) project factors, (2) social factors, (3) psychological factors, and (4) organisational factors.

  1. Project Factors – cost & benefits, duration of the project
  2. Social Factors – rivalry between projects, need for external justification, social norms
  3. Organisational Factors – structural and political environment of the project
  4. Psychological Factors – managers previous experience, sunk-cost effects, self-justification

In 1995 Keil & Mann conducted a survey among IS-Auditors, among their most interesting findings are

  • 38.3% of all SW development projects show some level of escalation (Original question: ‚In your judgement, how many projects are escalated?‘).
  • When asked ‚From your last 5 projects how many escalated?‘ 19% of the auditors said none, 28% said 1, 20% said 2, 16% said 3, 10% said 4 and 8% said all 5.
  • Escalation of schedule 38% of projects 1-12 months, 36% 13-24 months, maximum in the sample was 21 years.
  • Average budget overrun of projects was 20%, when projects escalate average budget overrun is 158%.
  • 82% of all escalated projects run over their budget, whilst only 48% of all non-escalated projects run over their budget
  • Success rate of escalated projects is devastating – of all escalated projects 23% were completed successfully, 18% were abandoned, 5% were completed but never implemented, 23% were partially completed, 18% were unsuccessfully completed, and 8% were completed and then withdrawn.

Furthermore, Keil & Mann test for the reasons for escalation behaviour, based on their 4 factor concept.  They found the main reasons for project escalations were

  • Underestimation of time to completion
  • Lack of monitoring
  • Underestimation of resources
  • Underestimation of scope
  • Lack of control
  • Changing specifications
  • Inadequate planning

Why Software Projects Escalate – An Empirical Analysis and Test of Four Theoretical Models (Keil et al., 2000)

Januar 12th, 2009

DSC01459

Keil, Mark; Mann, Joan; Rai, Arun: Why Software Projects Escalate – An Empirical Analysis and Test of Four Theoretical Models; in: MIS Quarterly, Vol. 24 (2000), No. 4, pp. 631-664.

The authors describe that: "Software projects can often spiral out of control to become ‚runaway systems’…".  Keil et al. define escalation behaviour as constantly adding resources to the project.  Thus escalated projects typically overrun their schedule and budget.  The authors describe the case of the Statewide Automated Child Support System (SACSS) of California’s Dept. of Social Services.  The project was started in 1992 with a projected budget of USD 75.5m and a go-live date in 1995.  The project escalated and did cost an estimated USD 345m and was finally terminated in 1997 without any deliverables in place. 

Based on a large scale survey of IS-Auditors Keil et al. found that 30-40% of all software development projects show some degree of escalation.  Then the authors analyse four different theoretical models how to explain escalation – (1) Self-Justification Theory, (2) Prospect Theory, (3) Agency Theory, (4) Approach Avoidance Theory.

Self-Justification Theory – SJT is grounded in Feistinger’s cognitive dissonance, most easily self-justification can be characterised as a retrospectively rationalising behaviour which is found to violate internal or external beliefs, attitudes, or norms.  As the wikipedia article on SJT describes it self-justification typically manifests in two forms internal SJT or external SJT.  Internal SJT strategies are changing the violated attitude, downplaying or denying the negative consequences; whilst external SJT strategies are all sorts of external excuses from bad luck, to lack of competencies.  Keil et al. argue that two effects are relevant for escalation behaviour – social and psychological self-justification.  Whilst psychological self-justification is a strategy to overcome dissonance, social pressures increase the need for self-justification, e.g., saving your face.

Prospect Theory – Kahneman & Tversky’s Prospect Theory and their Cumulative Prospect Theory describes decision-making under uncertainty and risk.  Keil et al. argue that Prospect Theory explains escalation behaviour, because the theory postulates that when choosing between two adverse events, deciders are seeking greater risks.  Commonly this is also referred to as ’sunk cost effect‘.

Agency Theory – Jensen & Meckling’s concept of principal-agent relationships covers many examples of principals delegating decision competencies or execution of tasks to agents.  A principal-agent relationships turns sour (aka principal-agent problem) when goal incongruence and information asymmetry create a constellation of imperfect contracting and monitoring.  In general terms – the agents maximise their self-interest at the expense of the principal.  Simplest real-world example – the software integrator who you hired to do most of your work never wants your project to finish.

Approach Avoidance Theory – Rubin & Brockner’s concept of approach avoidance which is described that every approach vs. avoidance decisions is driven by the iconic little angel vs. little devil.  In the case of escalated projects, these forces either encourage persistence or abandonment of the project.  Three factors explain why projects are not terminated – (1) size of reward for goal attainment, (2) withdrawal costs, and (3) goal proximity.  Keil et al. argue that especially the third factor ‚goal proximity‘ creates a completion effect which is explained by the need for task closure.  They argue that this is a better conceptualisation of escalation symptoms than the sunk cost effect, aka throw good money after bad money.  They describe that completion effects pull an individual towards the goal whilst sunk cost effects push an individual further.  A beautiful real life example is the 90%-completion syndrome:

This syndrome refers to the tendency for estimates of work completed to increase steadily until a plateau of 90% is
reached. Thereafter, programmer estimates of the fraction of work completed increase very slowly. In some cases, inaccurate estimation leads to situations in which software projects are reported to be 90% complete for half of the entire duration of the project, an obvious impossibility (Brooks 1975).

Keil et al. test 6 constructs taken from these 4 theories which were previously connected to escalation behaviour – psychological self-justification, social self-justification, sunk cost effect, goal incongruence, information asymmetry, and completion effect.
With a series of pairwise logistic regression models between the groups of escalated vs. non-escalated projects – all 6 constructs and therefore all 4 theories can empirically be proven.  However the best classifier for escalation vs. non-escalation is the completion effect.

Institutional reform (Stone, 2008)

Januar 9th, 2009

DSC01437

Stone, Alastair: Institutional reform – A decision-making process view; in: Research in Transportation Economics, Vol. 22 (2008), No. 1, pp. 164-178.

Stone analyses the fundamentals of the DMP (decision-making process) and proposes a model which he then applied to the example of urban land passenger transport.   This summary focuses on the analysis of the DMP.  Firstly, Stone draws a model which combines DMP costs with product scale and assumes a positive correlation between these two = the larger the product the higher the DMP costs. He outlines the entity involved, analytical mechanisms, and analytical techniques, e.g.,  for large-scale products the entity is usually a large collective, an expert analyst is the mechanism of choice for analysis, and a product specific discounted cash flow is the technique for the analysis.  Secondly, Stone shows that over time in the DMP the number of options decreases, whilst the average value of each option increases.

More interestingly he looks at different decisions and identifies 4 levels of societal decision processes

  1. Embeddedness = informal institutions, customs and traditions, norms and religion (happens every 100 to 1.000 years; is explained by social theory; and the purpose of it is non-calculative and spontaneous)
  2. Institutional environment = formal rules of the game (happens every 10 to 100 years; is explained by economics of property rights; and the purpose of it is to get the institutional environment right)
  3. Governance = play of the game (happens every 1 to 10 years; is explained by transaction cost economics; and the purpose of it is to get the governance structures right)
  4. Resource allocations (happen continuously; is explained by neo-classical economics; and have the purpose of getting the marginal conditions right)

Higher level impose constraints on lower level decisions, whilst these return feedback to the top. Finally, he outlines the DMP:
Input Variables (utilities, motivation, rights & power, and information) go into the Choice Mechanism (analysis & judgement) and result in a Resource Demand.

Decision-Making for New Technology – A Multi-Actor, Multi-Objective Method (Cunningham & Lei, 2007)

Januar 9th, 2009

DSC01433

Cunningham, Scott W.; van der Lei, Telli E.: Decision-Making for New Technology: A Multi-Actor, Multi-Objective Method; in: Management of Engineering and Technology, 2007, No. 5-9, pp. 1176-1185.

Cunningham & Lei present a method that does not aggregate the individuals‘ preferences but instead considers strategic and economic factors in the assessment of multi-criteria decision making (MCDA).

They explicitly model exogenous and intrinsic values into their criteria. The exogenous values are based on MCDA (value at risk & trade-offs), and game theory (strategies & values).  The intrinsic values are based on cooperative game theory (negotiations), and preferences (revealed preferences from historic choices & value elicitation).

Using weighted linear value functions they model the system of a decision-maker on new technology.  Then the authors expand their system model to include alliances and outside options.  Their results show are somehow unexpected, the system does not agree on an equilibrium price (aka exchange rate), because individual companies in the alliance profit from raising prices locally within the network.  Thus they ask: "Given scarce resources, where must alliances trades be made to maximally enhance profitability?"