Archive for the ‘Public Sector’ Category

Governance Frameworks for Public Project Development and Estimation (Klakegg et al., 2008)

Montag, November 3rd, 2008

 Governance Frameworks for Public Project Development and Estimation (Klakegg et al., 2008)

Klakegg, Ole Jonny; Williams, Terry; Magnussen, Ole Morten; Glasspool, Helene: Governance Frameworks for Public Project Development and Estimation; in: Project Management Journal, Vol. 39 (2008), Supplement, pp. S27–S42.
DOI: 10.1002/pmj.20058

Klakegg et al. compare different public governance frameworks, particularly the UK’s Ministry of Defense, UK’s Office of Government Commerce, and Norway’s framework. The authors find that „the frameworks have to be politically and administratively
well anchored. A case study particularly looking into cost and time illustrates how the framework influences the project through scrutiny. The analysis shows the governance frameworks are important in securing transparency and control and clarifies the role of sponsor“ (p. S27)

Their analysis starts with the question of „Who are governance relevant stakeholders?„. The authors show two different general approaches to public governance stakeholders – Shareholder Value Systems and Communitarian Systems. The Shareholder Value System is based on the principle that only shareholders are legitimate stakeholders – a system which is used in the US, UK, and Canada. On the other hand the Communitarian System is based on the idea that all impacted communities and persons are relevant stakeholders – a system typically found in Norway, Germany, and numerous other countries. A secondary line of thought is the difference between Western and Asian stakeholder ideas, whereas the Asian idea is underlining the concept of family and the Western idea is underlining the relationship concept.

To pin down the idea of public project governance the authors draw parallels to corporate governance with it’s chain of management ↔ board ↔ shareholder ↔ stakeholder. The APM defines project governance as the corporate governance that is related to projects with the aim that sustainable alternatives are choosen and delivered efficiently. Thus the authors define a governance framework as an organised structure, authoritive in organisation with processes and rules established to ensure the project meets its purpose.

The reviewed governance frameworks show interesting differences – for example in the control basis, reviewer roles, report formats, supporting organisation, and mode of initiation. The principles they are based on range from management of expectations, to establishing hurdles to cross, to making recommendations. Focus of the reviews can be the business case, outputs, inputs, or used methods.

Making a difference? Evaluating an innovative approach to the project management Centre of Excellence in a UK government department (O’Leary & Williams, 2008)

Donnerstag, Oktober 23rd, 2008

Making a difference? Evaluating an innovative approach to the project management Centre of Excellence in a UK government department (O’Leary & Williams, 2008)

O’Leary, Tim; Williams, Terry: Making a difference? Evaluating an innovative approach to the project management Centre of Excellence in a UK government department; in: International Journal of Project Management, Vol. 26 (2008), No. 5, pp. 556-565.
http://dx.doi.org/10.1016/j.ijproman.2008.05.013

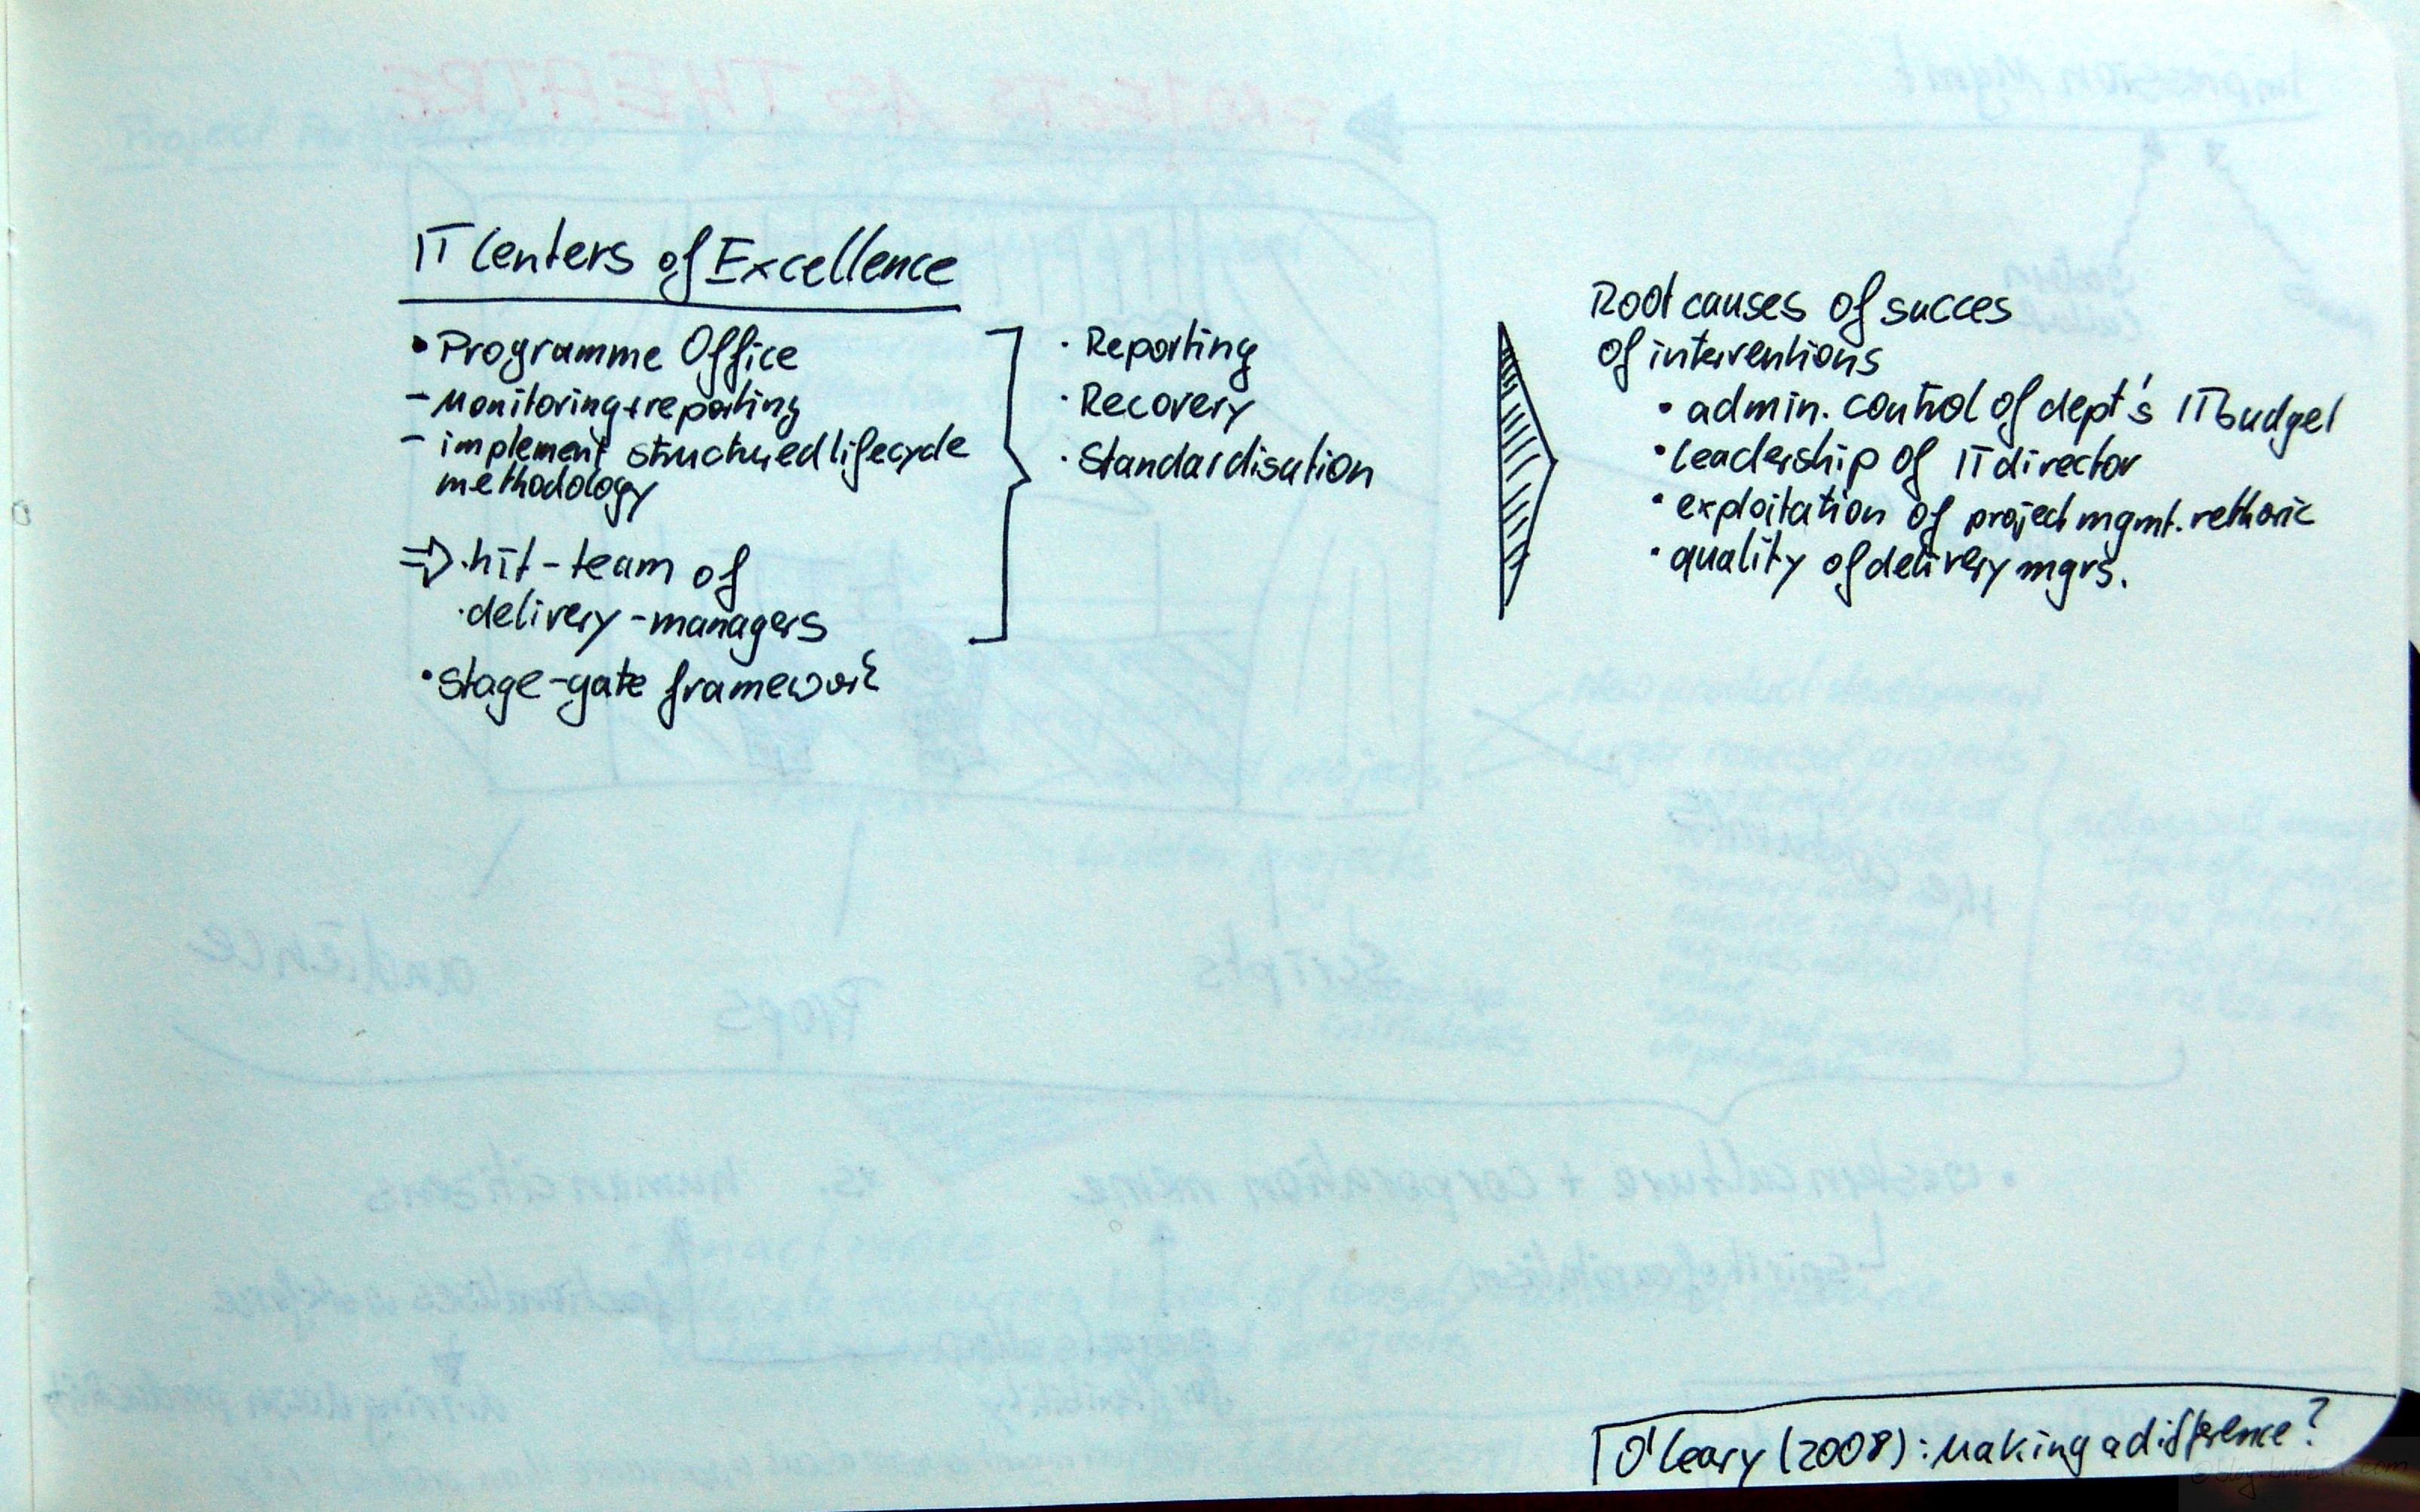
The UK has rolled out the ambitious programme of setting-up IT Centres of Excellence in all its departments. Focal point of these Centres of Excellence are Programme Offices.

The role of these Programme Offices has been defined as: Reporting, Recovering & Standardising.
The objectives for the programme offices are monitoring and reporting the status of the IT initiatives in the department, and implementing a structured life cycle methodology. This methodology ties in with a stage-gate framework that needs to be introduced. Additionally hit-teams of delivery managers have been set-up to turn-around ailing projects.

O’Leary and Williams find that the interventions seem to work successfully, whereas the reporting and standardisation objective has yet to be fulfilled. Moreover the authors analyse the root causes for this success. They found that the basis of success was:

  • Administrative control of department’s IT budget
  • Leadership of IT director
  • Exploitation of project management rhetoric
  • Quality of delivery managers

A multicriteria satisfaction analysis approach in the assessment of operational programmes (Ipsilandis et al., 2008)

Montag, September 22nd, 2008

A multicriteria satisfaction analysis approach in the assessment of operational programmes (Ipsilandis et al., 2008)

Ipsilandis, Pandelis G.; Samaras, George; Mplanas, Nikolaos: A multicriteria satisfaction analysis approach in the assessment of operational programmes; in: International Journal of Project Management, Vol. 26 (2008), No. 6, pp. 601-611.
http://dx.doi.org/10.1016/j.ijproman.2007.09.003

Satisfaction measurement was one of my big things for a long time, when I was still working in market research. I still believe in the managerial power of satisfaction measurements, although you might not want to do it every 8 weeks rolling. Well, that’s another story and one of these projects where a lot of data is gathered for no specific decision-making purpose and therefore the data only sees limited use.

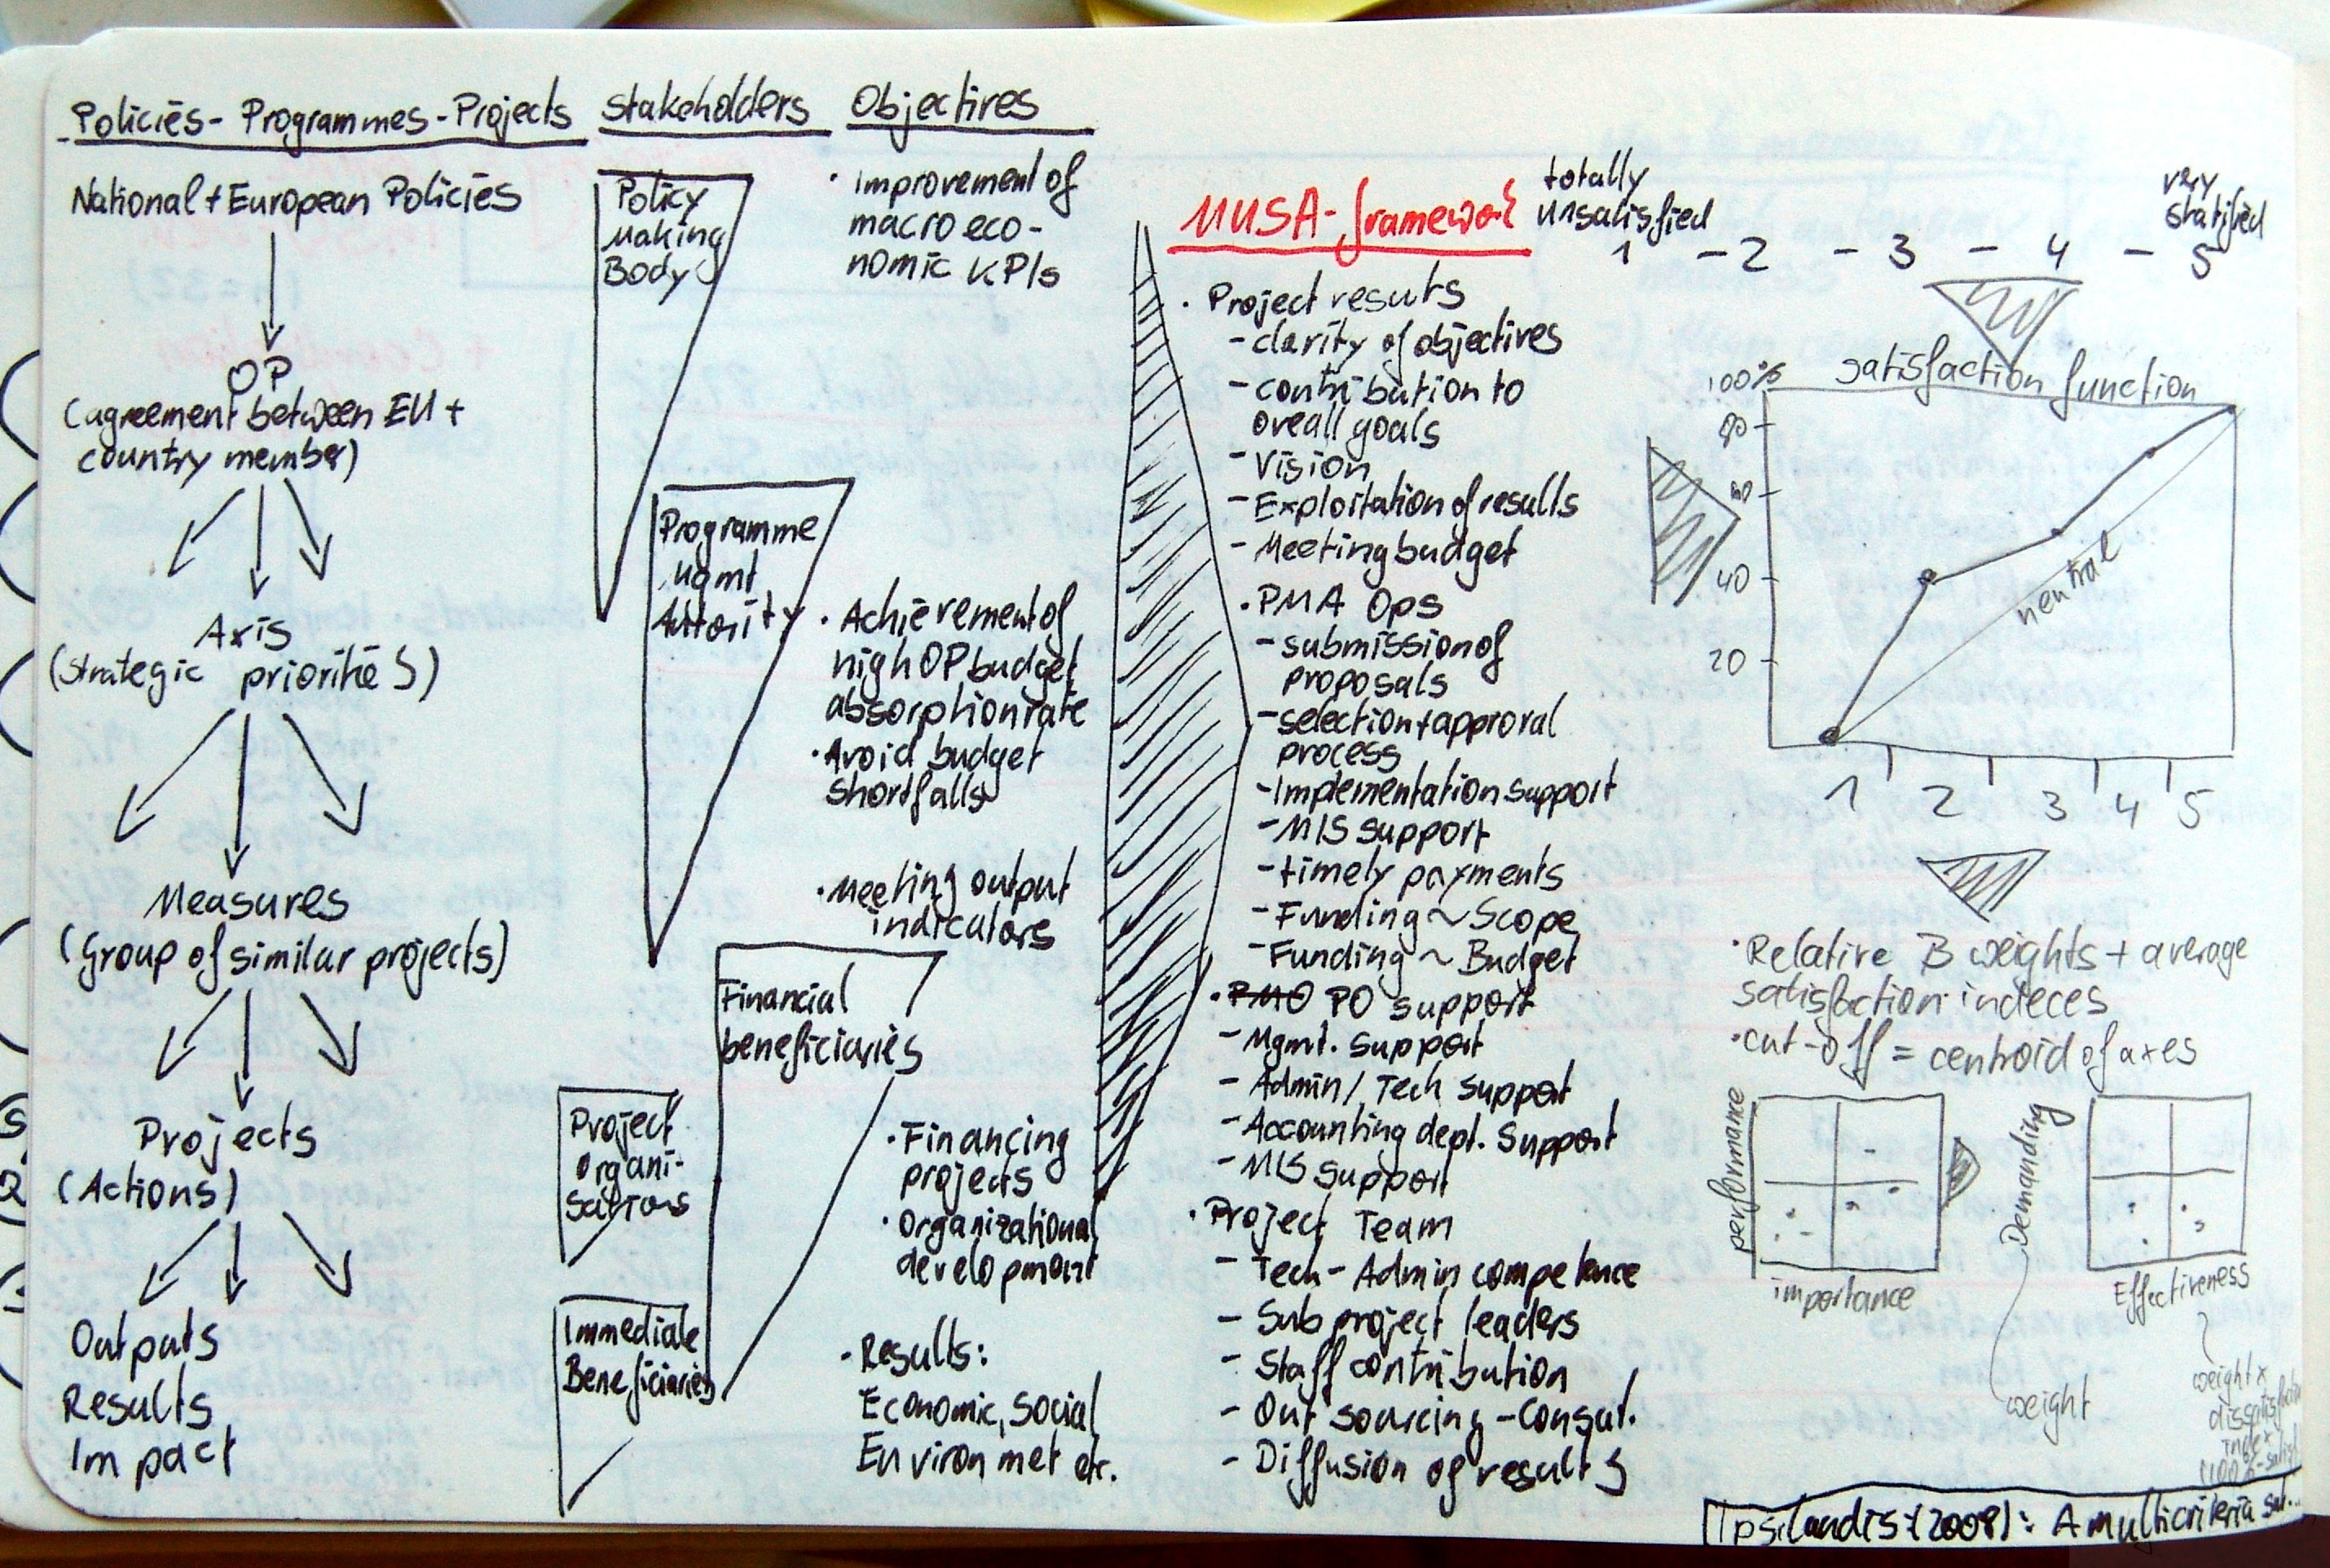
Anyway, Ipsilandis et al. design a tool to measure project/programme satisfaction for European Union programmes. First of all they give a short overview (for all the non-knowing) into the chain of actions at the EU. On top of that chain sit the national/european policies, which become operational programmes (by agreement between the EU and national bodies). Programmes consists of several main lines of actions called axis, which are also understood as strategic priorities. The axis are further subdevided into measures, which are groups of similar projects or sub-programmes. The measures itself contain the single projects, where the real actions take place and outputs, results, and impact is achieved. [I always thought that just having a single program management body sitting on top of projects can lead to questionable overhead.]

Ipsilandis et al. further identify the main stakeholders for each of the chain of policies –> projects. The five stakeholders are – policy making bodies, programme management authority, financial beneficiaries, project organisations, immediate beneficiaries. The authors go on to identify the objectives for each of these stakeholder groups. Then Ipsilandis et al. propose a MUSA framework (multi criteria satisfaction analysis) in which they measure satisfaction (on a five point scale, where 1=totally unsatisfied, and 5=very satisfied)

  • Project results
    • Clarity of objectives
    • Contribution to overall goals
    • Vision
    • Exploitation of results
    • Meeting budget
  • Project management authority operations
    • Submission of proposals
    • Selection and approval process
    • Implementation support
    • MIS support
    • Timely payments
    • Funding ~ Scope
    • Funding ~ Budget
  • Project Office support
    • Management support
    • Admin/tech support
    • Accounting dept. support
    • MIS support
  • Project Team
    • Tech/admin competence
    • Subproject leader
    • Staff contribution
    • Outsourcing/consultants
    • Diffusion of results

The authors then run through a sample report, which contains the typical representations of satisfaction scores, but they have 3 noteworthy ideas – (1) the satisfaction function, (2) performance x importance matrix, and (3) demanding x effectiveness matrix. The satisfaction function is simply the distribution function of satisfaction scores.
[I still do not understand why the line between 0% at score 1 and 100% at score 5 should represent neutrality – Such a line would assume uniform distribution of scores, where I think normal distribution is more often the case, which is also acknowledged by the authors, when they try to establish beta-weights via regression analysis, where normality is a pre-requisite for.]

Furthermore Ipsilandis et al. continue to establish the relative beta-weights for each item and calculate the average satisfaction index accordingly (satisfaction is indexed at 0% to 100%). Cutting-off at the centroid on each axis they span a 2×2 matrix for importance (beta-weight) vs. performance (satisfaction index). The authors call these diagrams „Action diagrams“.
[Centroid of the axis is just a cool way of referring to the mean.]

The third set of diagrams, the so called „Improvement diagrams“, are demanding vs. effectiveness matrices. The demanding dimension is defined by the beta-weights once more. The rational behind this thinking is, that a similar improvement leads to higher satisfaction at items with a higher beta-weight. The effectiveness dimension is the weighted dissatisfaction index. Simply put it is beta-weight*(100%-satisfaction index %). Reasoning behind this is to identify the actions with a great marginal contribution to overall satisfaction and only little effort needed.
[I still don’t understand why this diagram is needed, since the same message is conveyed in the ‚action diagrams‘ – anyway, a different way of showing it. Same, same but different.
What I previously tried to fiddle around with are log-transformations, e.g. logit, to model satisfaction indeces and their development in a non-linear fashion, instead of just weighting and normalising them. Such a procedure would put more importance on very low and very high values, following the reasoning, that fixing something completely broken is a big deal, whereas perfecting the almost perfect (think choosing the right lipstick for Scarlett Johannson) is not such a wise way to spend your time and money (fans of Ms. Johannson might disagree).]
Evaluating leadership, IT quality, and net benefits in an e-government environment (Prybutok et al., 2008)

Mittwoch, September 17th, 2008

Evaluating leadership, IT quality, and net benefits in an e-government environment (Prybutok et al., 2008)

Prybutok, Victor, R.; Zhang, Xiaoni; Ryana, Sherry D.: Evaluating leadership, IT quality, and net benefits in an e-government environment; in: Information & Management; Vol. 45 (2008), No. 3, pp. 143-152.
http://dx.doi.org/10.1016/j.im.2007.12.004

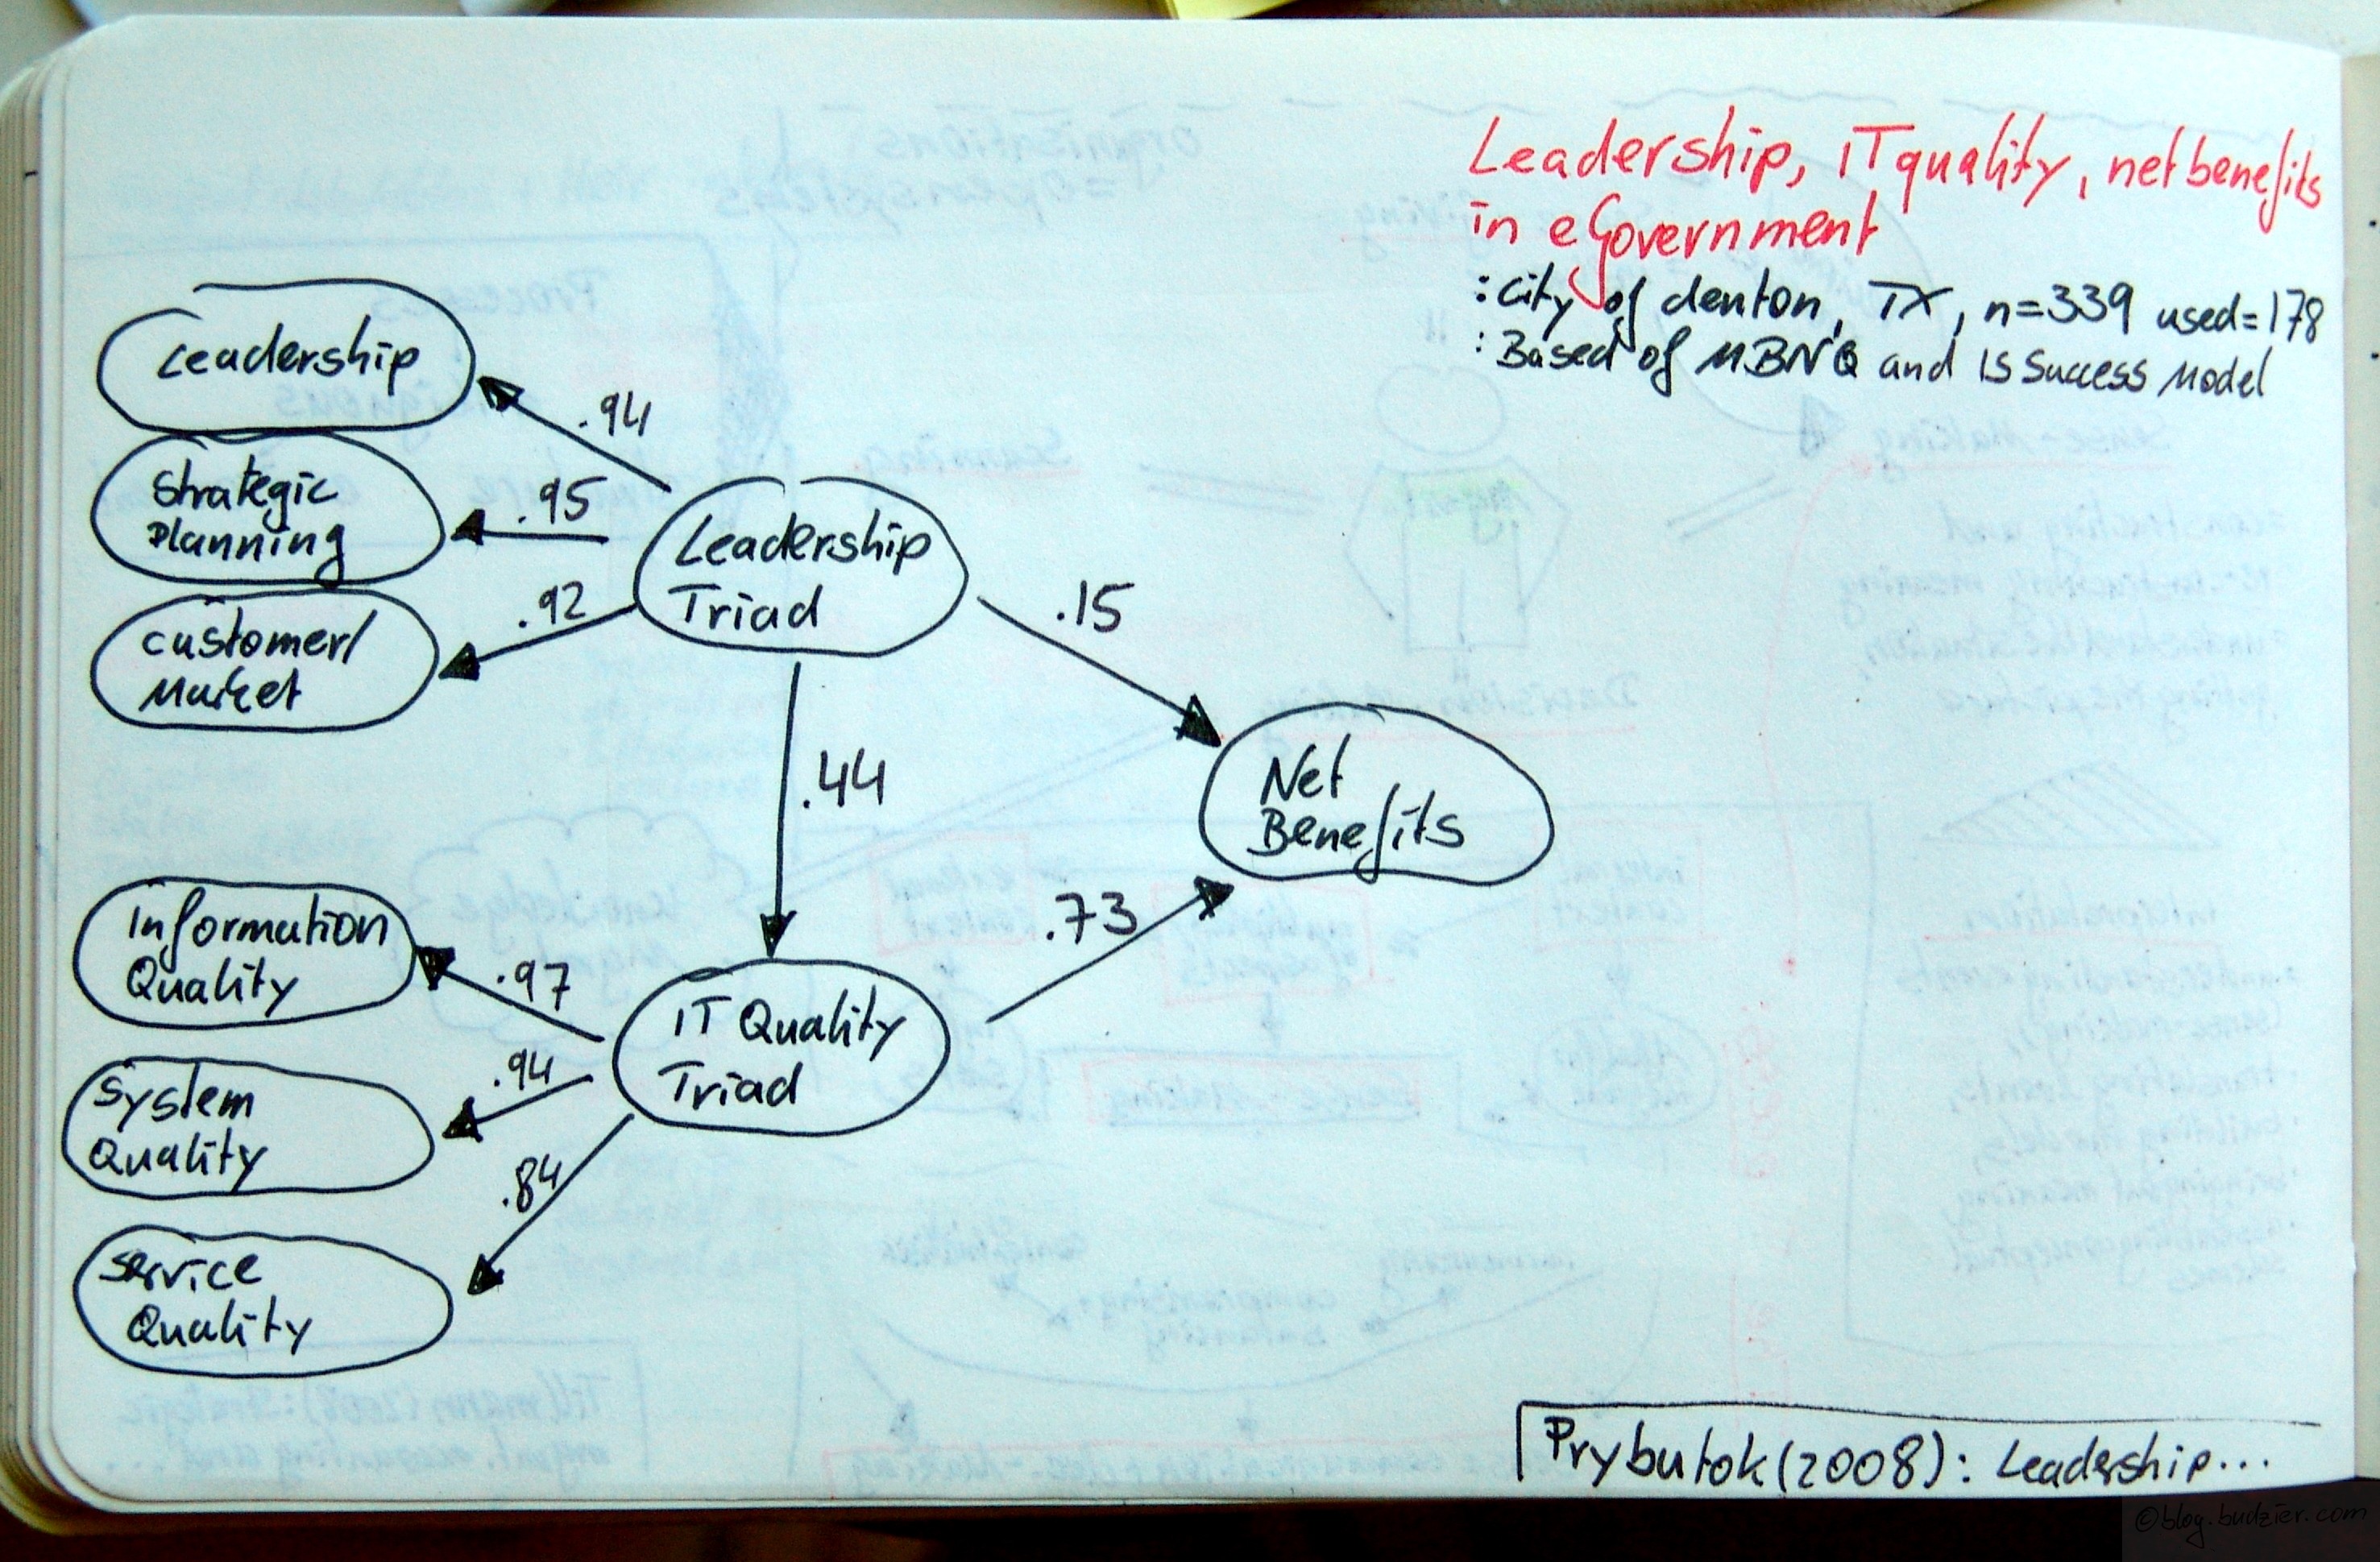
The authors did something quit unusual in eGovernment research, they went quantitative. Their survey consisted of 178 useful respondents among the public workers of Denton, TX. It generally tried to establish the cause-effect relationships between

  • Leadership Triad
    • Leadership
    • Strategic Planning
    • Customer/Market Focus
  • IT Quality Triad
    • Information Quality
    • System Quality
    • Service Quality
  • Net Benefits

The results support the hypothesis that the MBNQA leadership triad has a positive impact on the IT quality triad. The authors also found that both leadership and IT quality increased the benefits.

Investing Smarter in Public Sector ICT (VAGO (Ed.), 2008)

Mittwoch, September 17th, 2008

 Investing Smarter in Public Sector ICT

Victorian Auditor-General’s Office (VAGO): Investing Smarter in Public Sector ICT, Melbourne 2008.
Download available here: http://download.audit.vic.gov.au/files/ICT_BPG_Intro.pdf

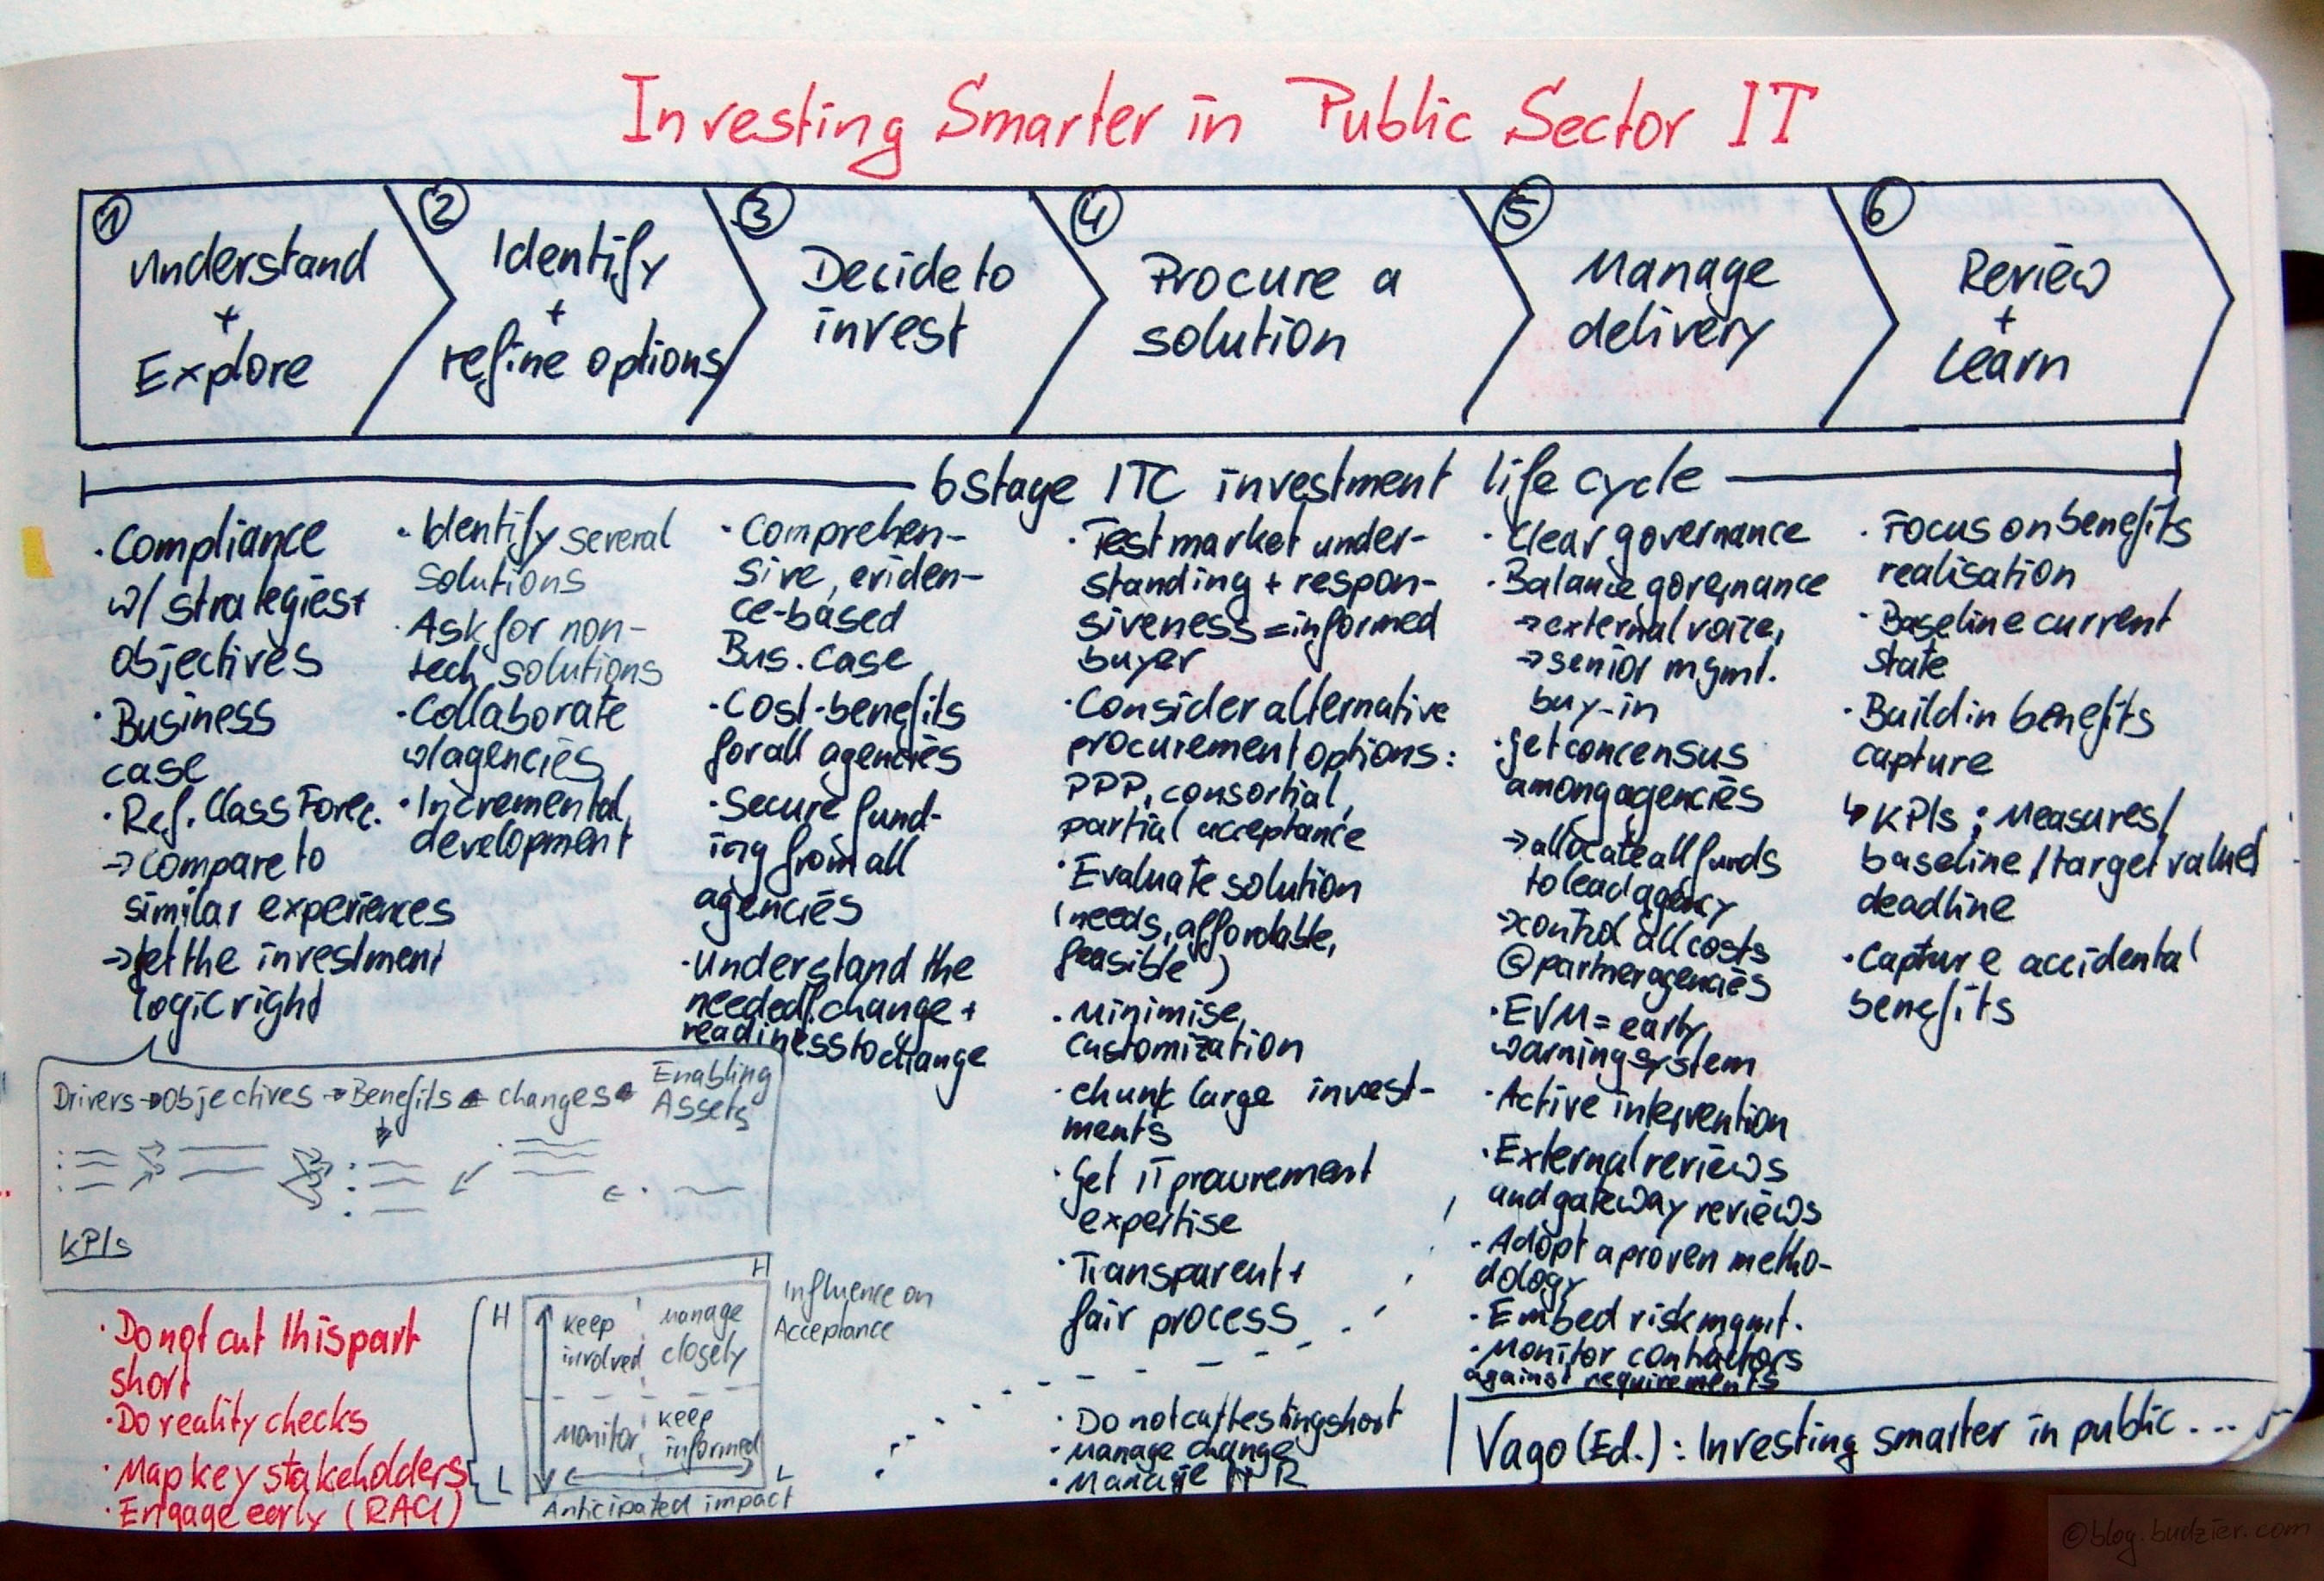
The VAGO has recently published (if I remember correctly it was end of July) a 6 step best practices guide on how to invest into ICT. The best part – it’s written in a clear, non-techy language. Readers don’t have to be the master genius of IT to put this into practice. They break down the ICT project flow into 6 distinct steps, which are
(1) Understand & Explore
(2) Identify & Refine options
(3) Decide to invest
(4) Procure a solution
(5) Manage delivery
(6) Review & Learn

The nice thing in this guide is that it lists a lot of best practices, things to avoid, and gives meaningful examples. Although most of the recommendations sound fairly basic (It’s basic not trivial!) the hard part is actually doing them. I would never ever have expected that benefits and costs are not calculated cross agencies, or that someone is not considering a non-tech solution.

A comprehensive framework for the assessment of eGovernment projects (Esteves & Joseph, 2008)

Mittwoch, Juli 9th, 2008

eGov Assessment

Esteves, José; Joseph, Rhoda C.: A comprehensive framework for the assessment of eGovernment projects; in: Government Information Quarterly, Vol. 25 (2008), No. 1, pp. 118-132.
http://dx.doi.org/10.1016/j.giq.2007.04.009

I clearly expected more noteworthy things to write down in my summary sketch. Esteves & Rhoda built a framework on 3 dimensions. (1) Assessment Dimensions for the project, (2) Stakeholders, and (3) eGovernment Maturity Level. For the first dimension, the assessment of the project itself, they describe 6 more dimensions to look into. These are the technology implemented, the strategy behind it, organisational fit, economic viability, operational efficiency and effectiveness, and the services offered.