Flyvbjerg, Bent: From Nobel Prize to Project Management – Getting Risks Right; in: Journal of Project Management, Vol. 37 (2006), No. 3, pp. 5-15.
I was asked by some colleagues at work to look into reference class forecasting. Along with similarity based forecasting (which I know mostly form the work of Dan Lovallo) both techniques try to eliminate the various heuristics and biases projections of future values usually fall prey to, both methods try to bring an outside perspective into the forecast either by anchoring (similarity based) or by regression towards the mean (reference class).
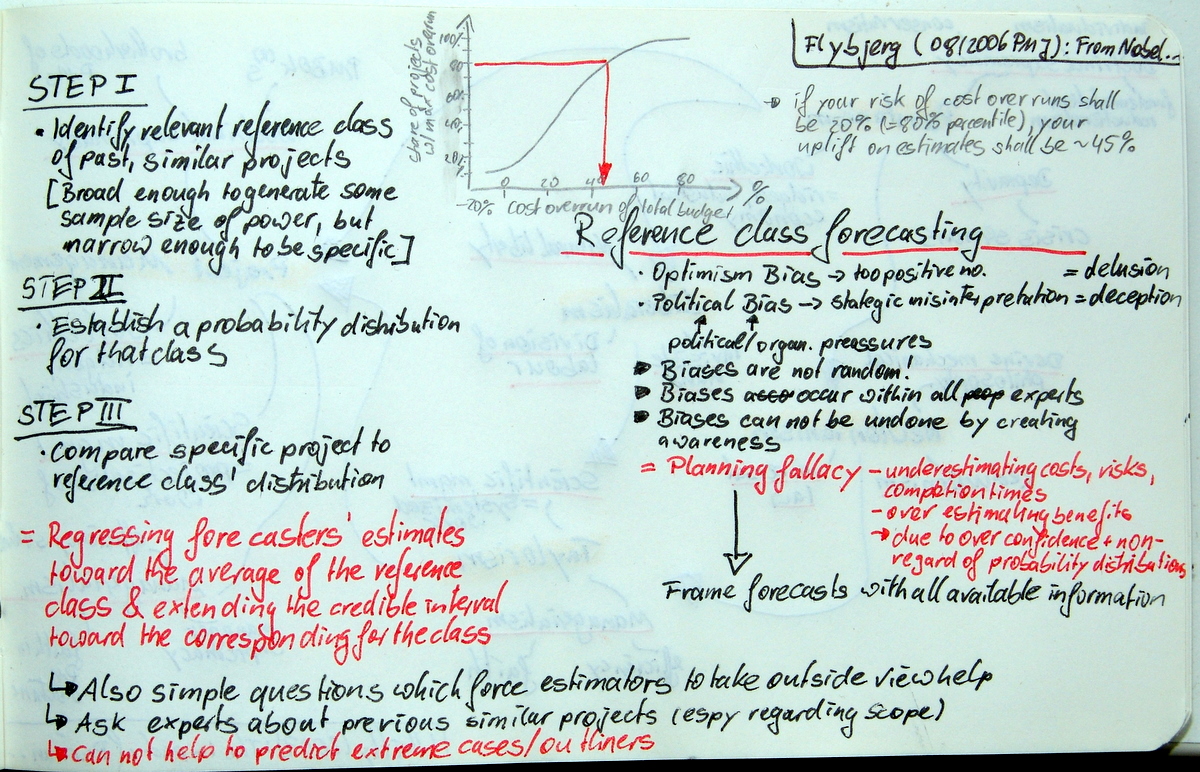
Flyvbjerg proposes a 3-step approach. (1) Identify a relevant reference class of past, similar projects, (2) establish a probability distribution of the optimism bias for that class, and (3) compare the forecast at hand to the reference class.
The optimism bias is operationalised by populating the density function of historical cost overruns vs. initial budget. This function serves two purposes – framing the forecast with as much un-biased information as possible, and regressing the forecast to the mean. In order to do so, the author recommends to add an uplift to the estimate. The uplift is dependent on the risk the owner is willing to take and can be found by looking up the expected budget overrun for the percentile which corresponds to the risk/confidence level.
In this article Flyvbjerg shows his data on cost overrun distribution on Fixed Link, Roads and Rail projects. He also outlines the required uplifts and discusses first applications of this method.
[I tried to model the distribution for IT Software Development Projects, based on the only publicly available data I could find – the Standish Group’s Chaos Report. Although the data can be seen as flawed (see Jørgensen & Moløkken review of their first report), I modelled the density function anyway and derived the wonderful S-Curve y = e 0.06250.38689/x (with R²=99.8%). Following the method outlined in Flyvbjerg’s article the required uplift would be Uplift = 0.387/(0.063-ln(confidence level)), e.g., for 80% confidence the uplift needs to be 135.25% and for 50% confidence the uplift would be 51.18%.]