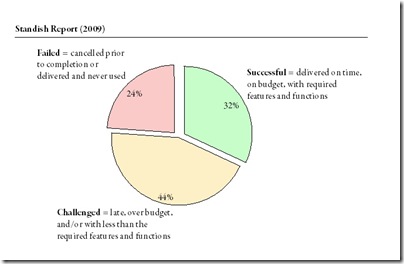
The Standish Group just published their new findings from the 2009 CHAOS report on how well projects are doing. This years figures show that 32% of all projects are successful, 44% challenged, and 24% fail. As the website says startling results especially that they still do not hold up to scientific standards and replications of this survey (e.g. Sauer, Gemino & Reich) find exactly the opposite picture.
Archive for the ‘Planning’ Category
Standish Chaos Report 2009
Dienstag, April 28th, 2009The resource allocation syndrome (Engwall & Jerbant, 2003)
Mittwoch, April 22nd, 2009Engwall, Mats; Jerbant, Anna: The resource allocation syndrome – the prime challenge of multi-project management?; in: International Journal of Project Management, Vol. 21 (2003), No. 6, pp. 403-409.
http://dx.doi.org/10.1016/S0263-7863(02)00113-8
Engwall & Jerbant analyse the nature of organisations, whose operations are mostly carried out as simultaneous or successive projects. By studying a couple of qualitative cases the authors try to answer why the resource allocation syndrome is the number one issue for multi-project management and which underlying mechanisms are behind this phenomenon.
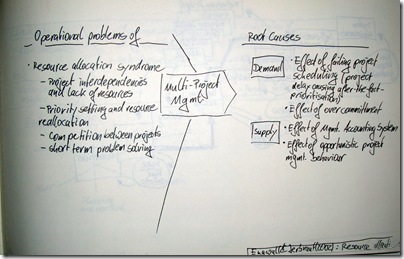
The resource allocation syndrome is at the heart of operational problems in multi-project management, it’s called syndrome because multi-project management is mainly obsessed with front-end allocation of resources. This shows in the main characteristics: projects have interdependencies and typically lack resources; management is concerned with priority setting and resources re-allocation; competition arises between the projects; management focuses on short term problem solving.
The root causes for these syndromes can be found on both the demand and the supply side. On the demand side the two root causes identified are the effect of failing projects on the schedule, the authors observed that project delay causes after-the-fact prioritisation and thus makes management re-active and rather unhelpful; and secondly over commitment cripples the multi-project-management.
On the supply side the problems are caused by management accounting systems, in this case the inability to properly record all resources and projects; and effect of opportunistic management behaviour, especially grabbing and booking good people before they are needed just to have them on the project.
Human Effort Dynamics and Schedule Risk Analysis (Barseghyan, 2009)
Dienstag, April 21st, 2009Barseghyan, Pavel: Human Effort Dynamics and Schedule Risk Analysis; in: PM World Today, Vol. 11(2009), No. 3.
http://www.pmforum.org/library/papers/2009/PDFs/mar/Human-Effort-Dynamics-and-Schedule-Risk-Analysis.pdf
Barseghyan researched extensively the human dynamics within project work. He has formulated a system of intricate mathematics quite similar to Boyle’s law and the other gas laws. He establishes a simple set of formulas to schedule the work of software developers.
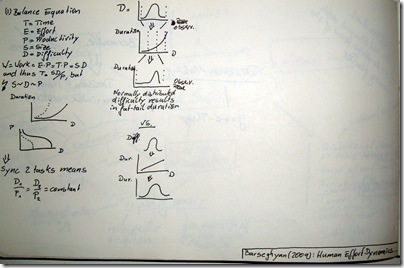
T = Time, E = Effort, P = Productivity, S = Size, and D = Difficulty
Then W = E * P = T * P = S * D, and thus T = S*D/P
But and now it gets tricky S~D~P are correlated!
The author has collected enough data to show the typical curves between Difficulty –> Duration and Difficulty –> Productivity. To schedule and synchronise two tasks the D/P ratio has to be constant between these two tasks.
Barseghyan then continues to explore the details between Difficulty and Duration. He argues that the common notion of bell-shaped distributions is flawed because of the non linear relationship between Difficulty –> Duration [note that his curves have a segment of linearity followed by some exponential part. If the Difficulty bell curve is transformed into the Diffculty–>Duration probability function using that non-linear transformation formula it looses is normality and results in a fat-tail distribution. Therefore Barseghyan argues, the notion of using bell-shaped curves in planning is wrong.
Understanding software project risk – a cluster analysis (Wallace et al., 2004)
Mittwoch, Januar 14th, 2009Wallace, Linda; Keil, Mark; Rai, Arun: Understanding software project risk – a cluster analysis; in: Information & Management, Vol. 42 (2004), pp. 115–125.
Wallace et al. conducted a survey among 507 software project managers worldwide. They tested a vast set of risks and tried to group these risks into 3 clusters of projects: high, medium, and low risk projects.
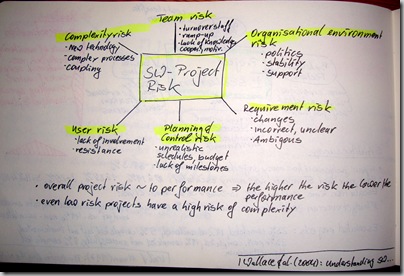
The authors assumed 6 dimensions of software project risks –
- Team risk – turnover of staff, ramp-up time; lack of knowledge, cooperation, and motivation
- Organisational environment risk – politics, stability of organisation, management support
- Requirement risk – changes in requirements, incorrect and unclear requirements, and ambiguity
- Planning and control risk – unrealistic budgets, schedules; lack of visible milestones
- User risk – lack of user involvement, resistance by users
- Complexity risk – new technology, automating complex processes, tight coupling
Wallace et al. showed two interesting findings. Firstly, the overall project risk is directly correlated to the project performance – the higher the risk the lower the performance! Secondly, they found that even low risk projects have a high complexity risk.
Uncertainty Sensitivity Planning (Davis, 2003)
Donnerstag, Januar 8th, 2009Davis, Paul K.: Uncertainty Sensitivity Planning; in: Johnson, Stuart; Libicki, Martin; Treverton, Gregory F. (Eds.): New Challenges – New Tools for Defense Decision Making, 2003, pp. 131-155; ISBN 0-8330-3289-5.
Who is better than planning for very complex environments than the military? On projects we set-up war rooms, we draw mind maps which look like tactical attack plans, and sometimes we use a very militaristic language. So what’s more obvious than a short Internet search on planning and military.
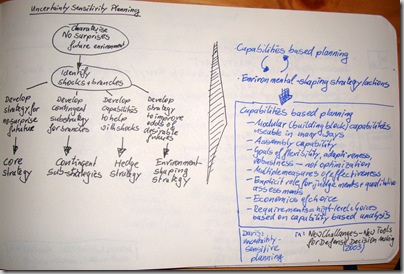
Davis describes a new planning method – Uncertainty Sensitivity Planning. Traditional planning characterises a no surprises future environment – much like the planning we usually do. The next step is to identify shocks and branches. Thus creating four different strategies
- Core Strategy = Develop a strategy for no-surprises future
- Contingent Sub-Strategies = Develop contingent sub-strategies for all branches of the project
- Hedge Strategy = Develop capabilities to help with shocks
- Environmental Shaping Strategy = Develop strategy to improve odds of desirable futures
Uncertainty Sensitivity Planning combines capabilities based planning with environmental shaping strategy and actions.
Capabilities based planning plans along modular capabilities, i.e., building blocks which are usable in many different ways. On top of that an assembly capability to combine the building blocks needs to be planned for. The goal of planning is to create flexibility, adaptiveness, and robustness – it is not optimisation. Thus multiple measurements of effectiveness exist.
During planning there needs to be an explicit role for judgements and qualitative assessments. Economics of choice are explicitly accounted for.
Lastly, planning requirements are reflected in high-level choices, which are based on capability based analysis.
Images as action instruments in complex projects (Taxén & Lilliesköld, 2008)
Montag, Oktober 20th, 2008Taxén, Lars; Lilliesköld, Joakim: Images as action instruments in complex projects; in: International Journal of Project Management, Vol. 26 (2008), No. 5, pp. 527-536.
http://dx.doi.org/10.1016/j.ijproman.2008.05.009
Images are quite powerful. I hate motivational posters which a distant corporate HQ decorates every meeting room with, but I once saw the department strategy visualised by these folks, they include all employees and the group dynamic is unbelievable. Later on they cleaned the images, blew them up, and posted them around the company – of course, meaningless for an outsider but a powerful reminder for everyone who took part.
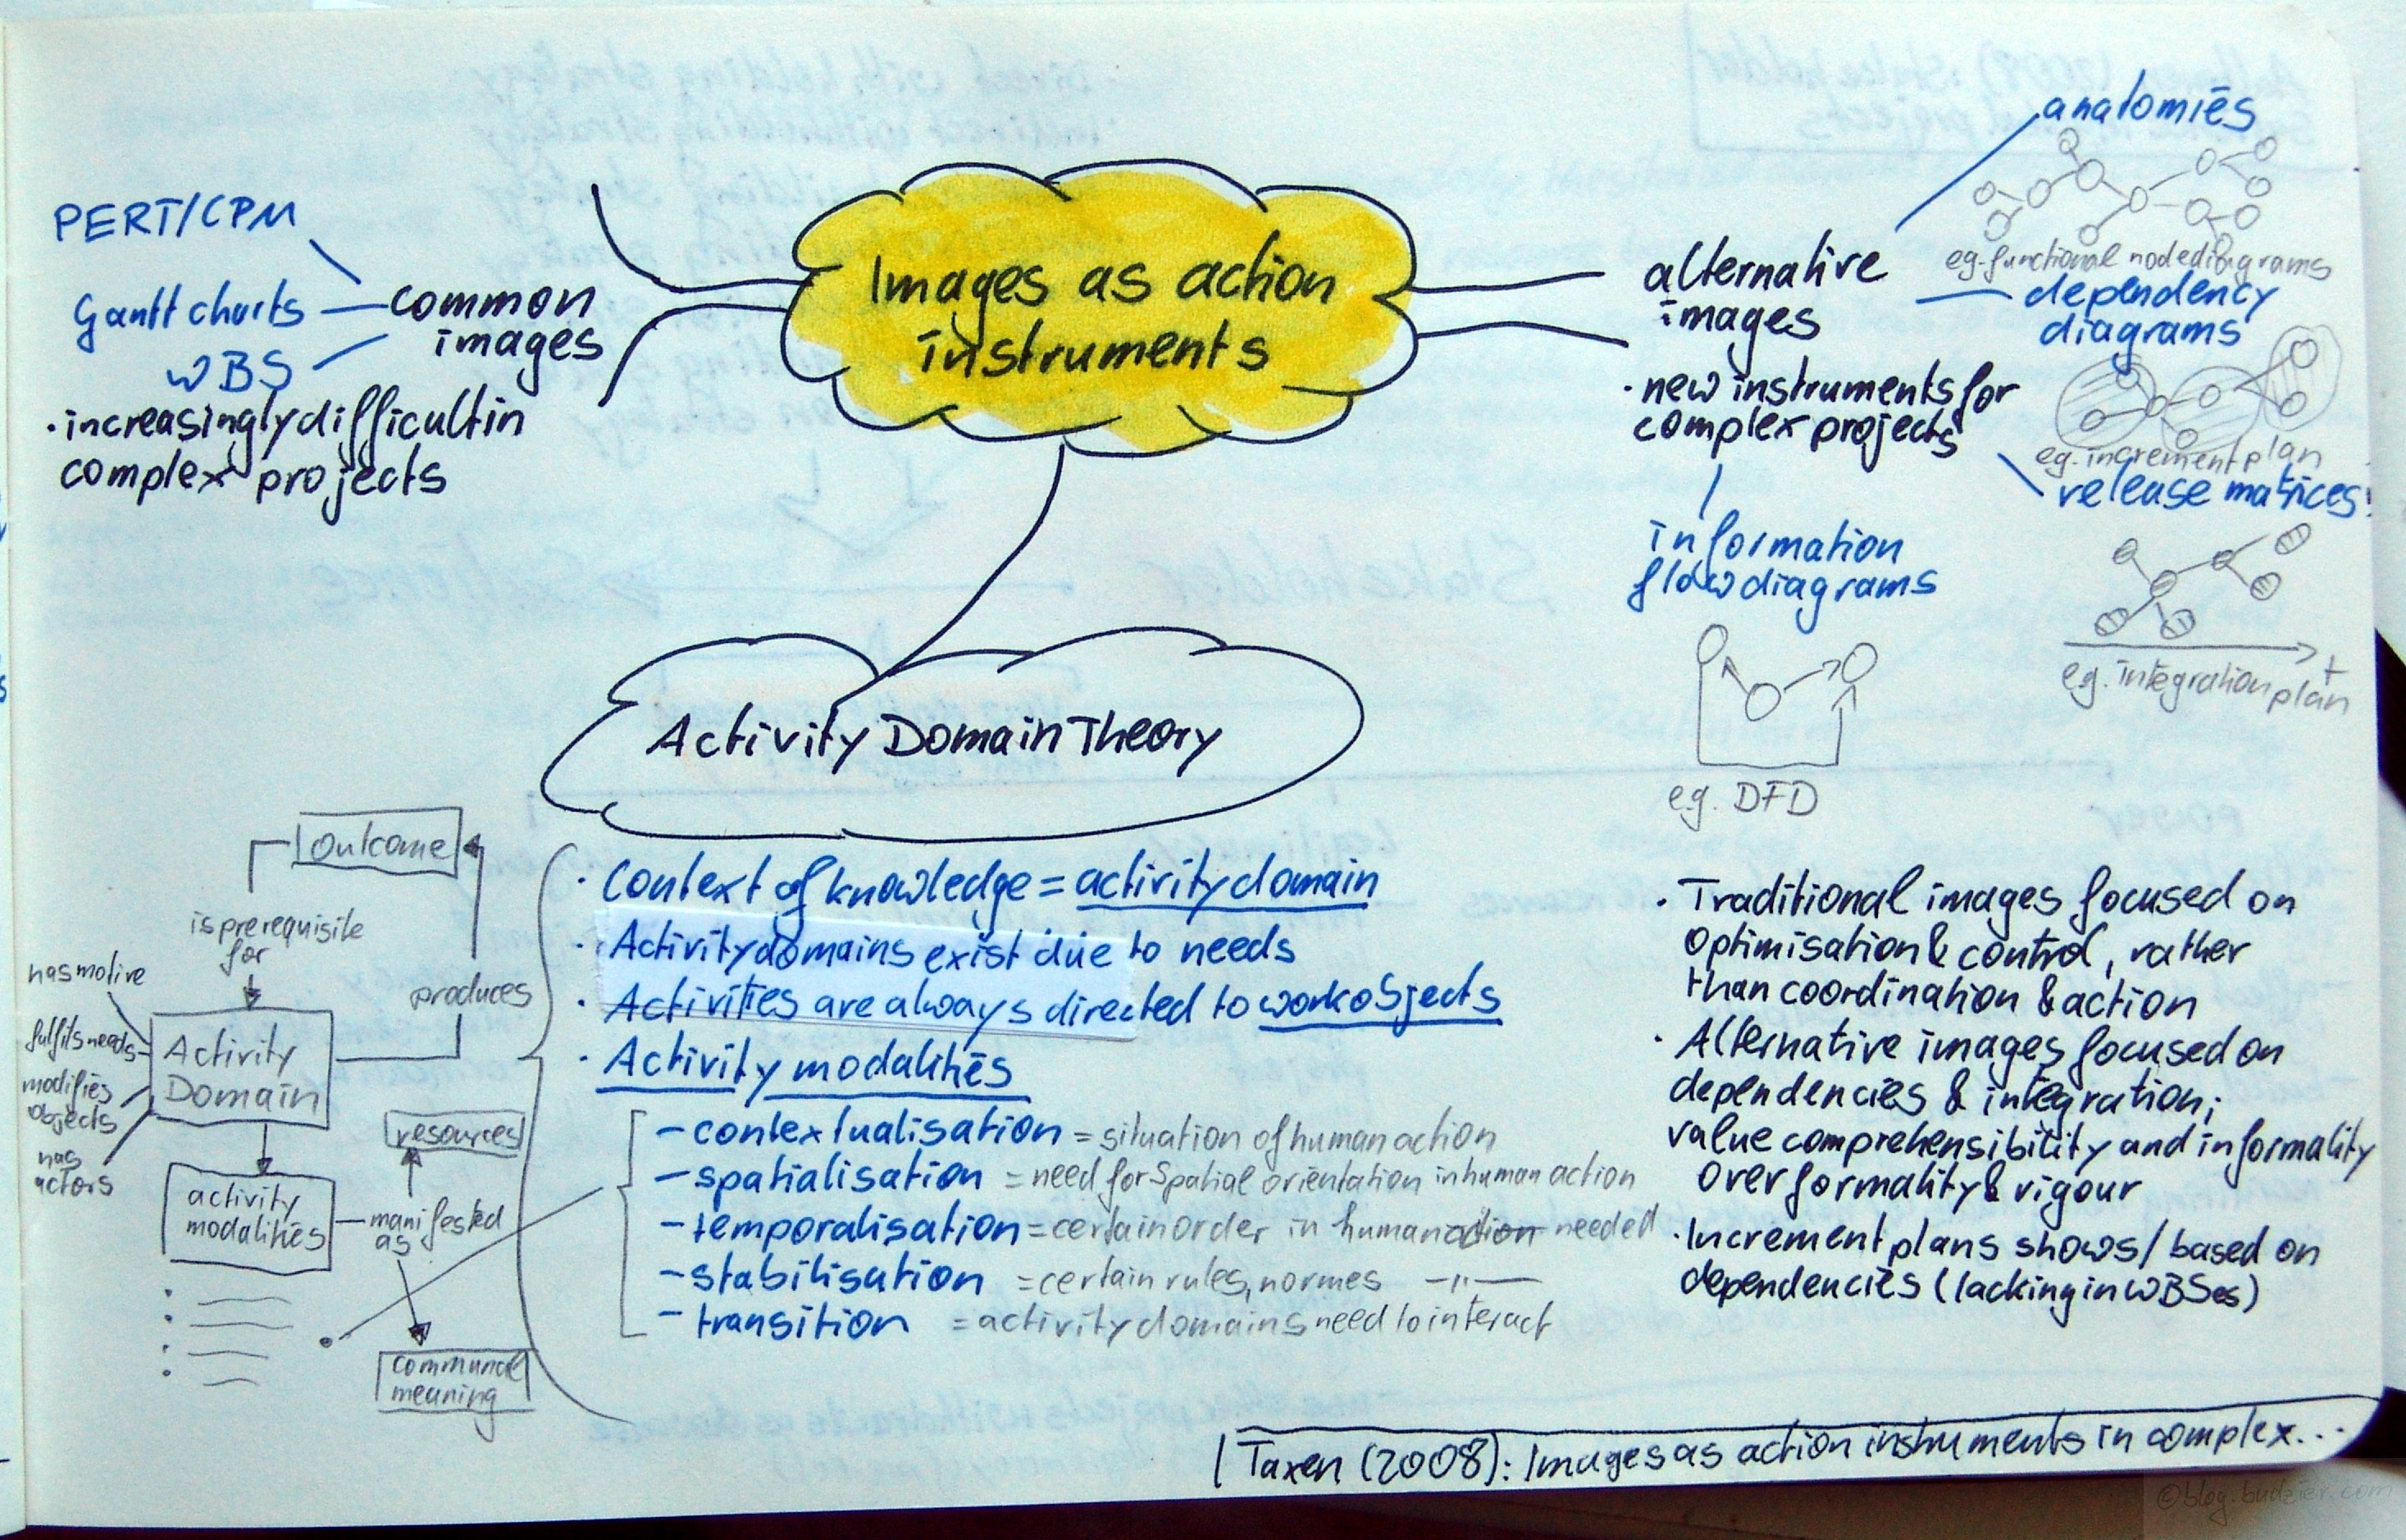
Taxén & Lilliesköld analyse the images typically used in project management. They find that these common images, such as PERT/CPM, Gantt charts, or WBS are increasingly difficult to use in complex projects, in this case the authors look into a large-scale IT project.
Based on Activity Domain Theory they develop alternative images better suited for complex projects. Activity Domain Theory, however, underlines that all tasks on a project (= each activity domain) have a motive, fulfils needs, modifies objects, and has actors. Outcomes are produced by activity domains and are at the same time prerequisites for activity domains. Activity domains have activity modalities, which can be either manifested as resources or as communal meaning. These activity modalities are
- Contextualisation = situation of human action
- Spatialisation = need for spatial orientation in human action
- Temporalisation = need for certain order in human action
- Stabilisation = need for certain rules and norms in human action
- Transition = need for interaction between activity domains
Useful images, the authors argue, need to fulfil these needs while being situated in the context of the activity. Traditional images focus on optimisation and control, rather than on coordination and action. Thus alternate images need to focus on dependencies and integration; on value comprehensibility and informality over formality and rigour.
Alternative images suited for complex project management are
- Anatomies – showing modules, work packages and their dependencies of the finished product, e.g., functional node diagrams
- Dependency diagrams – showing the incremental assembly of the product over a couple of releases, e.g. increment plan based on dependencies (a feature WBS lack)
- Release matrices – showing the flow of releases, how they fit together, and when which functionality becomes available, e.g., integration plan
- Information flow diagrams – showing the interfaces between modules, e.g. DFD
A comprehensive model for selecting information system project under fuzzy environment (Chen & Cheng, in press)
Dienstag, Oktober 7th, 2008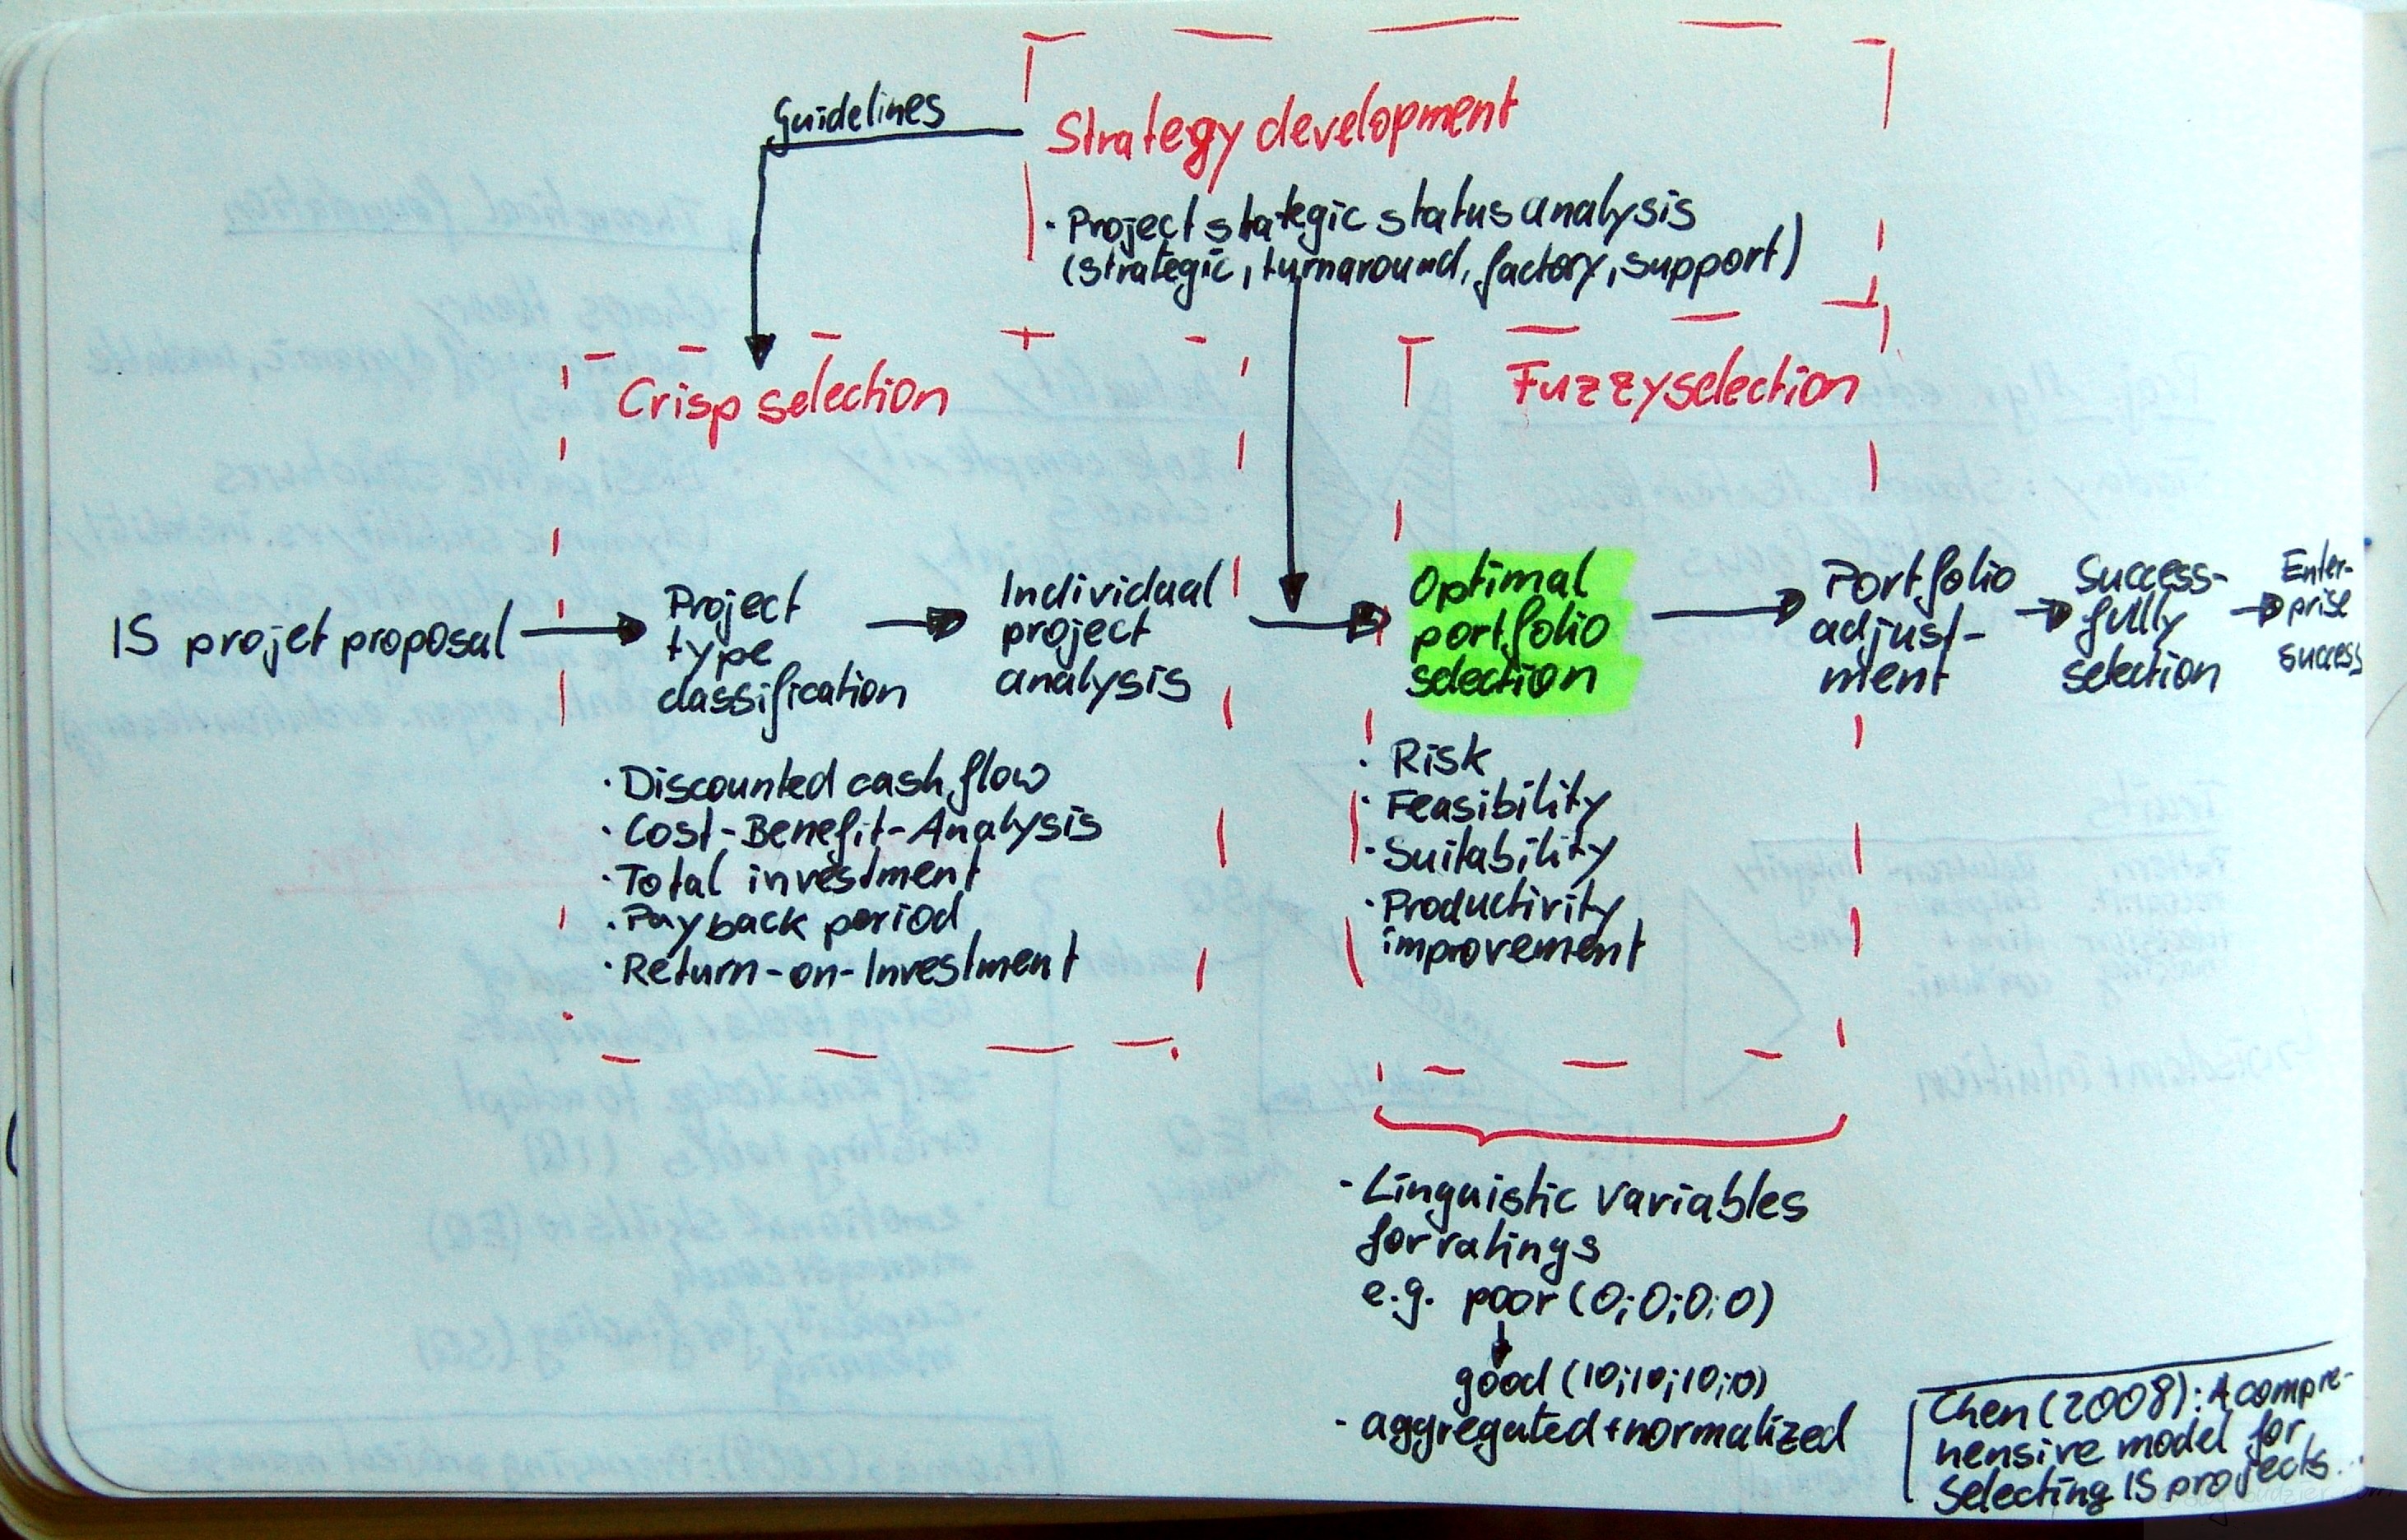 Chen, Chen-Tung; Cheng, Hui-Ling: A comprehensive model for selecting information system project under fuzzy environment; in: International Journal of Project Management, in press.doi:10.1016/j.ijproman.2008.04.001Update: this article has been published in: International Journal of Project Management Vol. 27 (2009), No. 4, pp. 389399.Upfront management is an ever growing body of research and currently develops into it’s own profession. In this article Chen & Cheng propose a model for the optimal IT project portfolio selection. They outline a seven step process from the IT/IS/ITC project proposal to the enterprise success
- IS/IT/ITC project proposal
- Project type classification
- Individual project analysis
- Optimal portfolio selection
- Portfolio adjustment
- Successfully selection
- Enterprise success
Behind the process are three different types of selection methods and tools – (1) crisp selection, (2) strategy development, and (3) fuzzy selection.The crisp selection is the first step in the project evaluation activities. It consists of different factual financial analyses, e.g. analysis of discounted cash flow, cost-benefits, total investment, payback period, and the return on investment.Strategy development is the step after the crisp selection, whilst it also impacts the first selection step by setting guidelines on how to evaluate the project crisply. Strategy development consists of a project strategic status analysis. According to Chen & Cheng’s framework a project falls in one of four categories – strategic, turnaround, factory, or support.The last step is the fuzzy selection. In this step typical qualitative characteristics of a project are evaluated, e.g., risk, feasibility, suitability, and productivity improvements. In this step lies the novelty of Chen & Cheng’s approach. They let the evaluators assign a linguistic variable for rating, e.g., from good to poor. Then each variable is translated into a numerical value, e.g., poor = 0, good = 10. As such, every evaluator produces a vector of ratings for each project, e.g., (0;5;7;2) – vector length depends on the number of characteristics evaluated. These vectors are then aggregated and normalised.[The article also covers an in-depth numerical example for this proposed method.]
Multicriteria cash-flow modeling and project value-multiples for two-stage project valuation (Jiménez & Pascual, 2008)
Dienstag, Oktober 7th, 2008Jiménez, Luis González; Pascual, Luis Blanco: Multicriteria cash-flow modeling and project value-multiples for two-stage project valuation; in: International Journal of Project Management, Vol. 26 (2008), No. 2, pp. 185-194.
http://dx.doi.org/10.1016/j.ijproman.2007.03.012
I am not the expert in financial engineering, though I built my fair share of business cases and models for all sorts of projects and endeavours. I always thought of myself as being not to bad at estimating and modelling impacts and costs, but I never had a deep knowledge of valuation tools and techniques. A colleague was claiming once that every business case has to work on paper with a pocket calculator in your hands. Otherwise it is way to complicated. Anyhow, I do understand the importance of a proper NPV calculation, to say the least even if you do fancy shmancy real options evaluation as in this article here, the NPV is one of the key inputs.
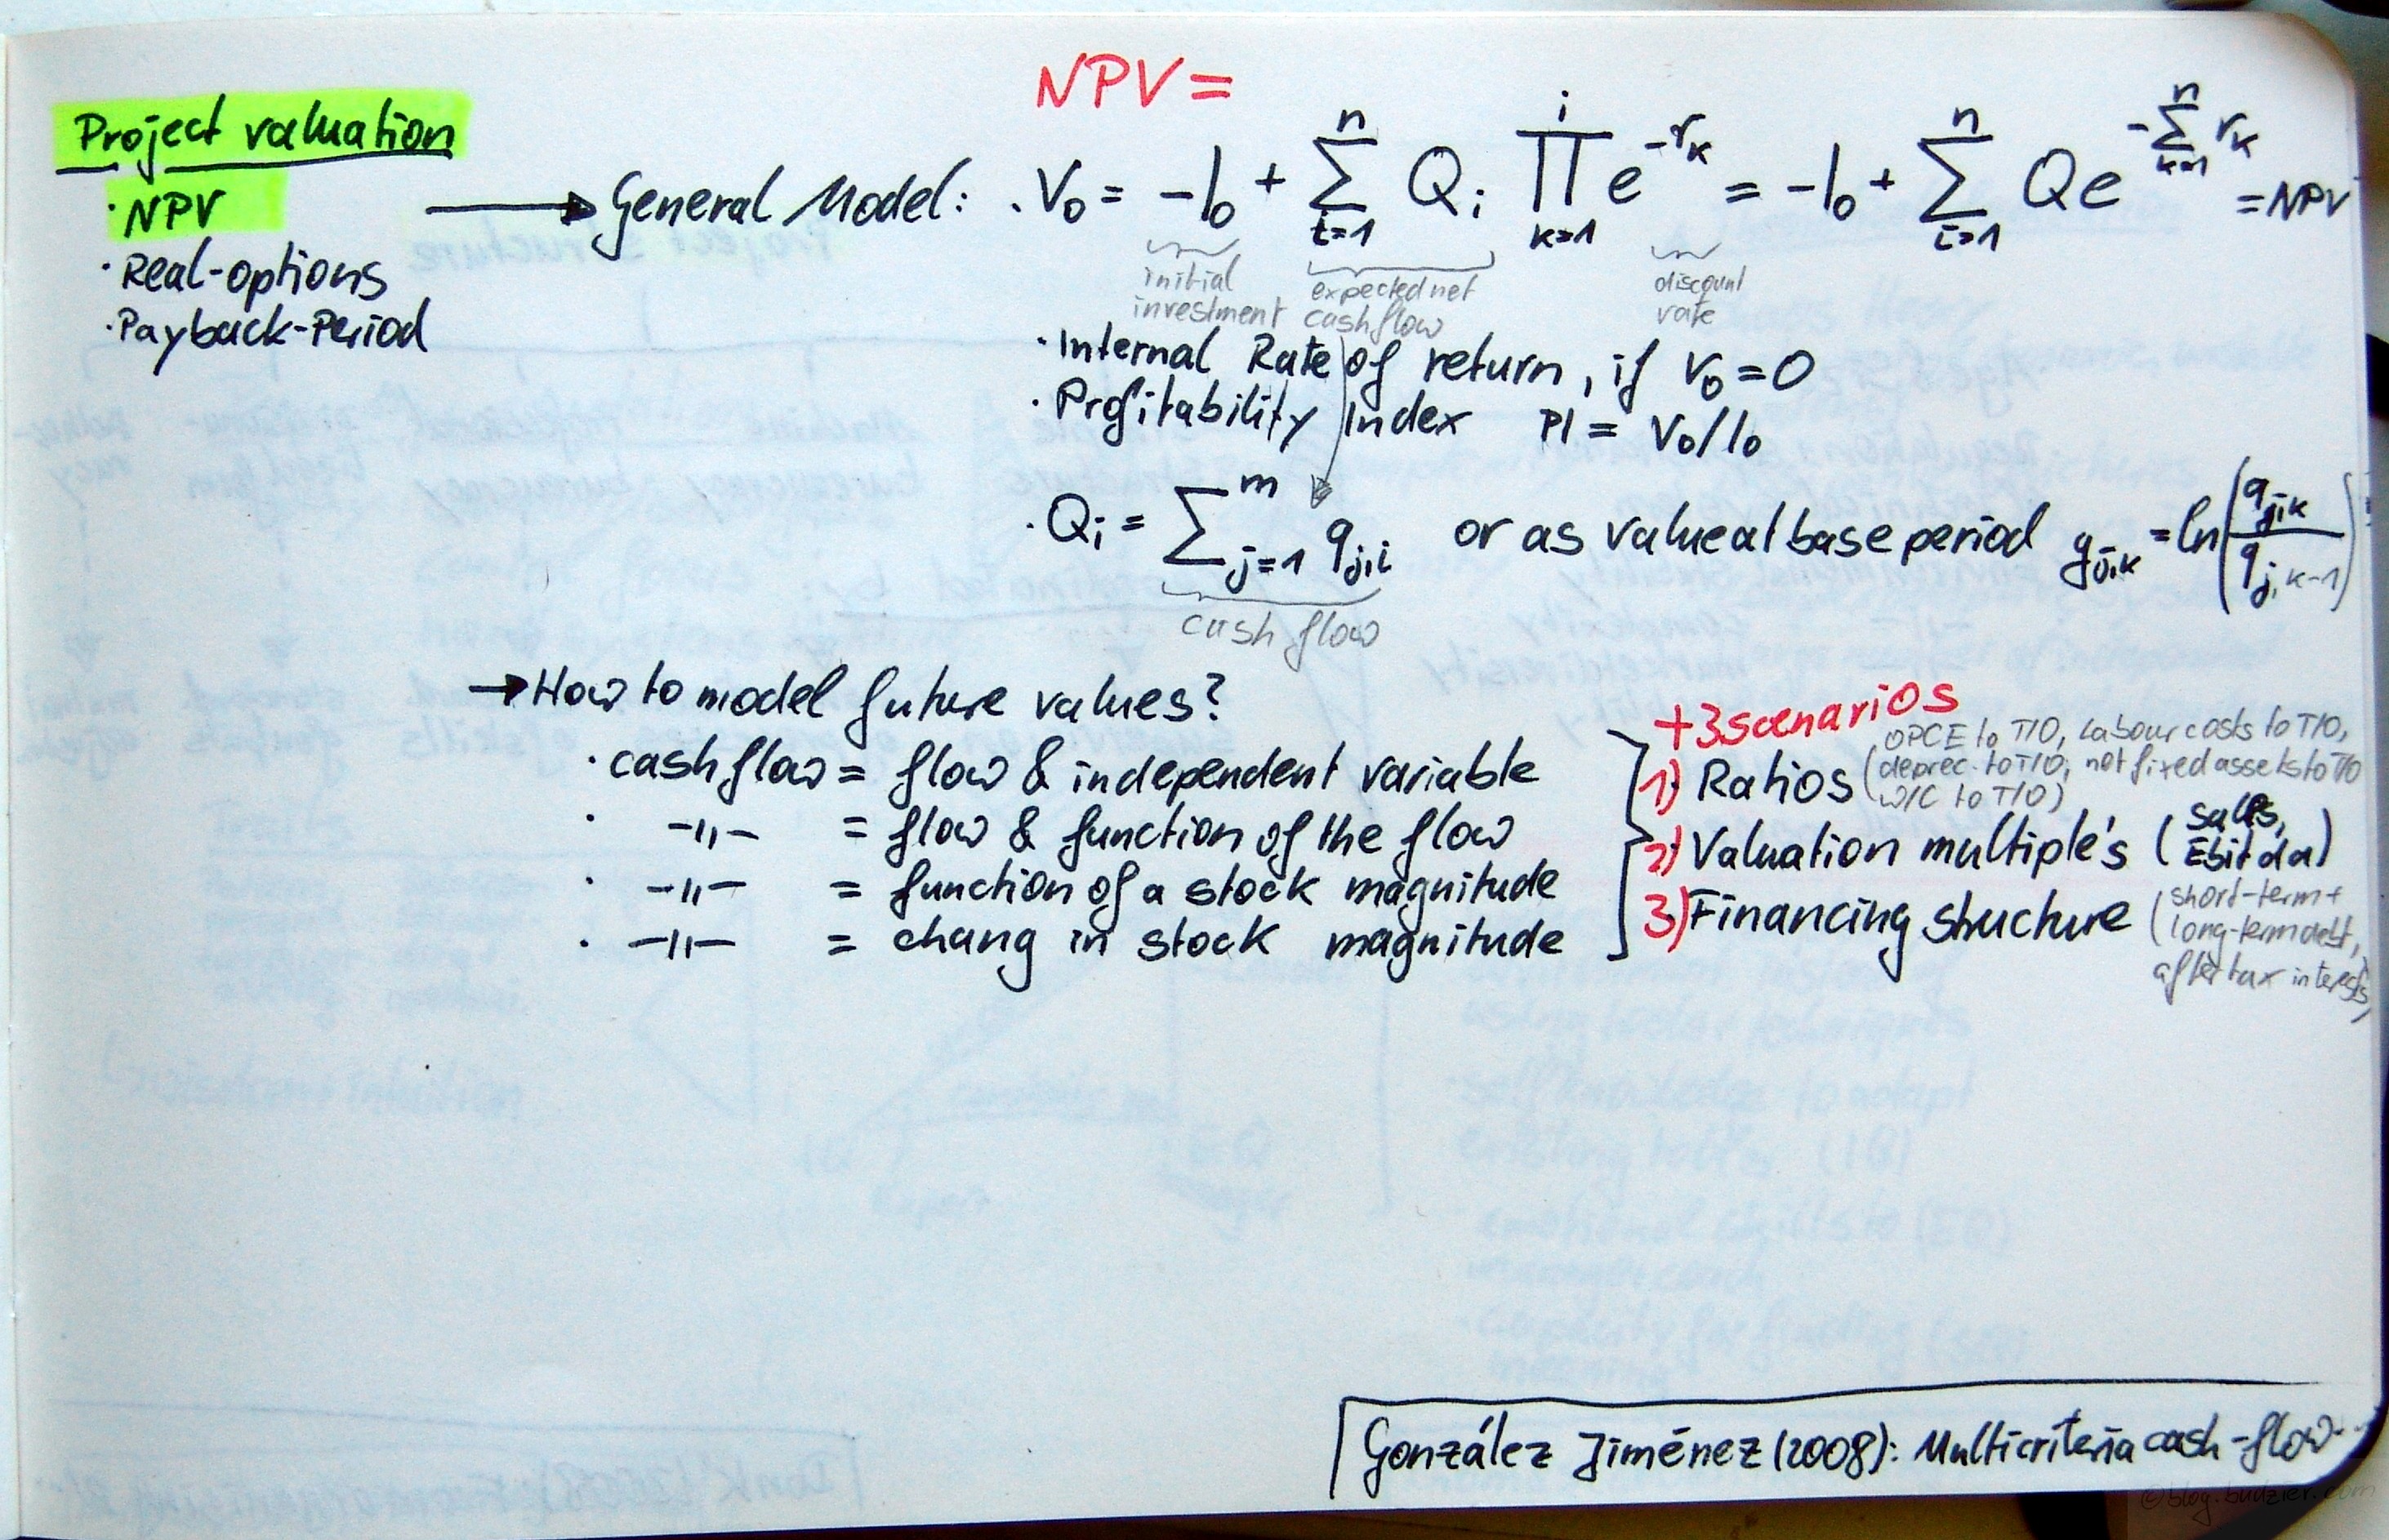
Jiménez & Pascual identify three common approaches to project valuation NPV, real options, and payback period calculations. Their article focusses on NPV calculation. They argue that a NPV calculation consists of multiple cash flow components and each of these has different underlying assumptions, as to it’s risk, value, and return.
The authors start with the general formula for a NPV calculation
NPV = V0 = -I0 + ∑Qi ∏e-rk = -I0 + ∑Q e-∑rk
This formula also gives the internal rate of return (IIR) if V0=0 and the profitability index (PI) is defined as PI = V0/I0. Furthermore Jiménez & Pascual outline two different approaches on how to model the expected net cash flow Qi either as cash flow Qi = ∑qj,i or as value based period gj,k = ln (qj,k/qj,k-1).
The next question is how to model future values of the cash flow without adjusting your assumptions for each and every period. The article’s authors suggest four different methods [the article features a full length explanation and numerical example for each of these]
- Cash Flow = Cash Flow + independent variable
- Cash Flow = Cash Flow + function of the cash flow
- Cash Flow = Function of a stock magnitude
- Cash Flow = Change in stock magnitude
Finally the authors add three different scenarios under which the model is tested and they also show the managerial implications of the outcome of each of these scenarios
- Ratios, such as operating cost and expenses (OPCE) to turnover (T/O), labour costs to T/O, depreciation to TIO, not fixed assets to T/O, W/C to T/O
- Valuation multiples, such as Sales, Ebitda
- Financing structure, such as short term, long term debt, after tax interests
Development of the SMART(TM) Project Planning framework (Hartman 2004)
Freitag, Juli 11th, 2008Hartman, Francis; Ashrafi, Rafi: Development of the SMARTTM Project Planning framework, in: International Journal of Project Management, Vol. 22 (2004), pp. 499-510.
Hartman & Ashrafi present a new trademarked framework for Project Planning. The idea behind this framework is to ensure that the project is SMART. Strategically Managed, Aligned with corporate strategy as well as stakeholder needs, Regenerative [sustainable] for the project team, and Transitional, which stands for smooth execution of changes to the project.
What is new? Four tools are presented by the authors (1) the SMART Breakdown Structure (SBS), (2) the priority triangle, (3) key questions, and (4) RACI+.
The SBS is basically a new take on the work break down structure. On the top-level is the project mission which is then broken down into the key stakeholders‘ expectations on the first level of decomposition. The next levels of decompositions break the expectations down to tangible deliverables. Furthermore they add a parking lot and an explicit list of exclusions.
The priority triangle extends the ABC-priority to 6 permutation of pairs of 2 priorities, e.g., Time (1st) and Cost (2nd); or Quality (1st) and Time (2nd).
The 3 key questions are (1) What is the final deliverable?, (2) What is everyone this project praising for?, and (3) Who decides the first two questions?
Finally the RACI+ chart (derived from the classical RACI „Responsibility, Accountability, Consult, Inform“-Matrix) clarifies the roles of each letter, R=responsible, A=action (does the work), C=consults (=has input, needs to be asked), I=informs (=reviews the output) and adds a new letter S=sanction (=signs-off acceptance).
A comprehensive framework for the assessment of eGovernment projects (Esteves & Joseph, 2008)
Mittwoch, Juli 9th, 2008Esteves, José; Joseph, Rhoda C.: A comprehensive framework for the assessment of eGovernment projects; in: Government Information Quarterly, Vol. 25 (2008), No. 1, pp. 118-132.
http://dx.doi.org/10.1016/j.giq.2007.04.009
I clearly expected more noteworthy things to write down in my summary sketch. Esteves & Rhoda built a framework on 3 dimensions. (1) Assessment Dimensions for the project, (2) Stakeholders, and (3) eGovernment Maturity Level. For the first dimension, the assessment of the project itself, they describe 6 more dimensions to look into. These are the technology implemented, the strategy behind it, organisational fit, economic viability, operational efficiency and effectiveness, and the services offered.
