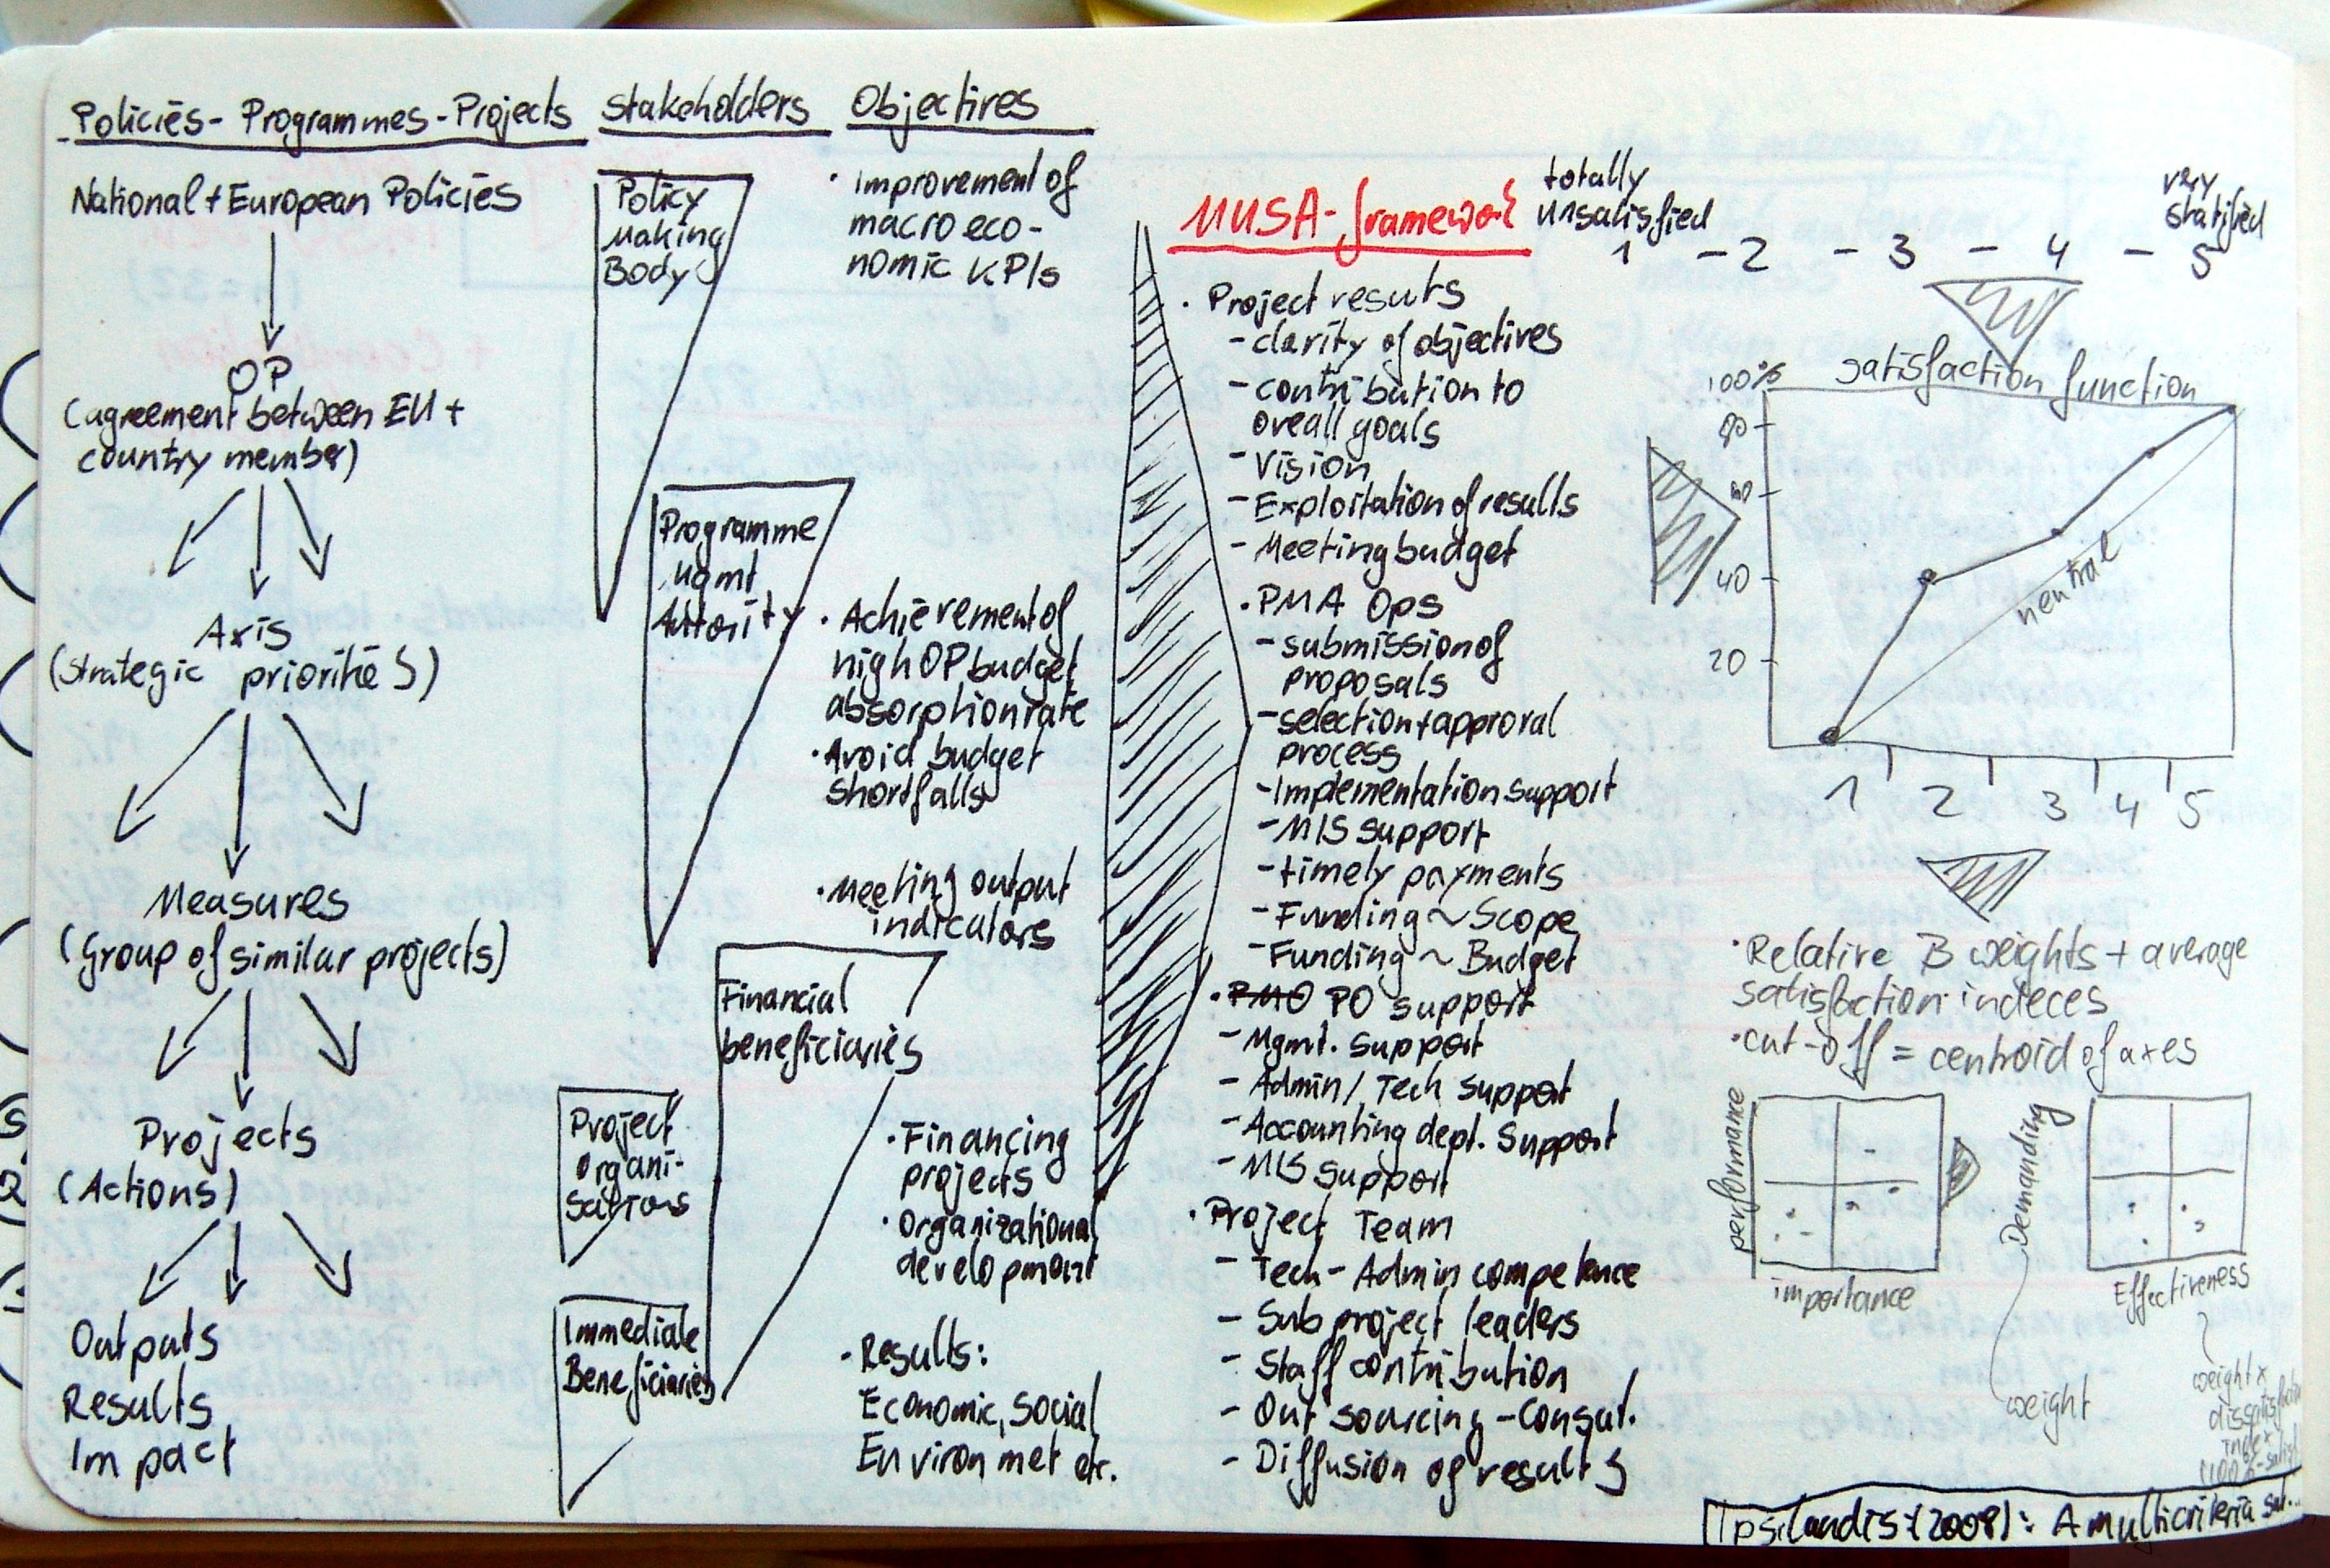
Ipsilandis, Pandelis G.; Samaras, George; Mplanas, Nikolaos: A multicriteria satisfaction analysis approach in the assessment of operational programmes; in: International Journal of Project Management, Vol. 26 (2008), No. 6, pp. 601-611.
http://dx.doi.org/10.1016/j.ijproman.2007.09.003
Satisfaction measurement was one of my big things for a long time, when I was still working in market research. I still believe in the managerial power of satisfaction measurements, although you might not want to do it every 8 weeks rolling. Well, that’s another story and one of these projects where a lot of data is gathered for no specific decision-making purpose and therefore the data only sees limited use.
Anyway, Ipsilandis et al. design a tool to measure project/programme satisfaction for European Union programmes. First of all they give a short overview (for all the non-knowing) into the chain of actions at the EU. On top of that chain sit the national/european policies, which become operational programmes (by agreement between the EU and national bodies). Programmes consists of several main lines of actions called axis, which are also understood as strategic priorities. The axis are further subdevided into measures, which are groups of similar projects or sub-programmes. The measures itself contain the single projects, where the real actions take place and outputs, results, and impact is achieved. [I always thought that just having a single program management body sitting on top of projects can lead to questionable overhead.]
Ipsilandis et al. further identify the main stakeholders for each of the chain of policies –> projects. The five stakeholders are – policy making bodies, programme management authority, financial beneficiaries, project organisations, immediate beneficiaries. The authors go on to identify the objectives for each of these stakeholder groups. Then Ipsilandis et al. propose a MUSA framework (multi criteria satisfaction analysis) in which they measure satisfaction (on a five point scale, where 1=totally unsatisfied, and 5=very satisfied)
- Project results
- Clarity of objectives
- Contribution to overall goals
- Vision
- Exploitation of results
- Meeting budget
- Project management authority operations
- Submission of proposals
- Selection and approval process
- Implementation support
- MIS support
- Timely payments
- Funding ~ Scope
- Funding ~ Budget
- Project Office support
- Management support
- Admin/tech support
- Accounting dept. support
- MIS support
- Project Team
- Tech/admin competence
- Subproject leader
- Staff contribution
- Outsourcing/consultants
- Diffusion of results
The authors then run through a sample report, which contains the typical representations of satisfaction scores, but they have 3 noteworthy ideas – (1) the satisfaction function, (2) performance x importance matrix, and (3) demanding x effectiveness matrix. The satisfaction function is simply the distribution function of satisfaction scores.
[I still do not understand why the line between 0% at score 1 and 100% at score 5 should represent neutrality – Such a line would assume uniform distribution of scores, where I think normal distribution is more often the case, which is also acknowledged by the authors, when they try to establish beta-weights via regression analysis, where normality is a pre-requisite for.]
Furthermore Ipsilandis et al. continue to establish the relative beta-weights for each item and calculate the average satisfaction index accordingly (satisfaction is indexed at 0% to 100%). Cutting-off at the centroid on each axis they span a 2×2 matrix for importance (beta-weight) vs. performance (satisfaction index). The authors call these diagrams „Action diagrams“.
[Centroid of the axis is just a cool way of referring to the mean.]
The third set of diagrams, the so called „Improvement diagrams“, are demanding vs. effectiveness matrices. The demanding dimension is defined by the beta-weights once more. The rational behind this thinking is, that a similar improvement leads to higher satisfaction at items with a higher beta-weight. The effectiveness dimension is the weighted dissatisfaction index. Simply put it is beta-weight*(100%-satisfaction index %). Reasoning behind this is to identify the actions with a great marginal contribution to overall satisfaction and only little effort needed.
[I still don’t understand why this diagram is needed, since the same message is conveyed in the ‚action diagrams‘ – anyway, a different way of showing it. Same, same but different.
What I previously tried to fiddle around with are log-transformations, e.g. logit, to model satisfaction indeces and their development in a non-linear fashion, instead of just weighting and normalising them. Such a procedure would put more importance on very low and very high values, following the reasoning, that fixing something completely broken is a big deal, whereas perfecting the almost perfect (think choosing the right lipstick for Scarlett Johannson) is not such a wise way to spend your time and money (fans of Ms. Johannson might disagree).]
