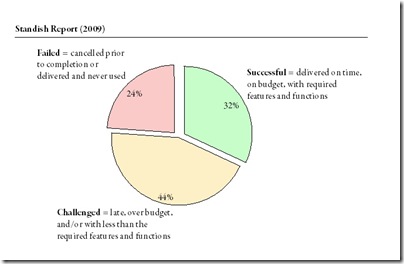
The Standish Group just published their new findings from the 2009 CHAOS report on how well projects are doing. This years figures show that 32% of all projects are successful, 44% challenged, and 24% fail. As the website says startling results especially that they still do not hold up to scientific standards and replications of this survey (e.g. Sauer, Gemino & Reich) find exactly the opposite picture.
Archive for the ‘Risk Management’ Category
Standish Chaos Report 2009
Dienstag, April 28th, 2009The influence of checklists and roles on software practitioner risk perception and decision-making (Keil et al., 2008)
Freitag, April 24th, 2009Keil, Mark; Li, Lei; Mathiassen, Lars; Zheng, Guangzhi: The influence of checklists and roles on software practitioner risk perception and decision-making; in: Journal of Systems and Software, Vol. 81 (2008), No. 6, pp. 908-919.
http://dx.doi.org/10.1016/j.jss.2007.07.035
In this paper the authors present the results of 128 role plays they conducted with software practitioners. These role plays analysed the influence of checklists on the risk perception and decision-making. The authors also controlled for the role of the participant, whether he/she was an insider = project manager or an outsider = consultant. They found the role having no effect on the risks identified.
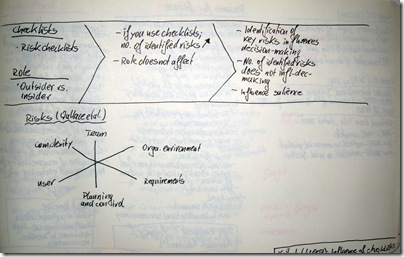
Keil et al. created a risk checklist based on the software risk model which was first conceptualised by Wallace et al. This model distinguishes 6 different risks – (1) Team, (2) Organisational environment, (3) Requirements, (4) Planning and control, (5) User, (6) Complexity.
In their role plays the authors found that checklists have a significant influence on the number of risks identified. However the number of risks does not influence the decision-making. Decision-making is influenced by the fact whether the participants have identified some key risks or not. Therefore the risk checklists can influence the salience of the risks, i.e., whether they are perceived or not, but it does not influence the decision-making.
Understanding software project risk – a cluster analysis (Wallace et al., 2004)
Mittwoch, Januar 14th, 2009Wallace, Linda; Keil, Mark; Rai, Arun: Understanding software project risk – a cluster analysis; in: Information & Management, Vol. 42 (2004), pp. 115–125.
Wallace et al. conducted a survey among 507 software project managers worldwide. They tested a vast set of risks and tried to group these risks into 3 clusters of projects: high, medium, and low risk projects.
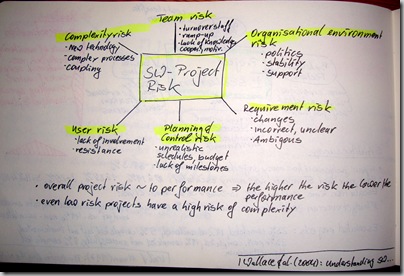
The authors assumed 6 dimensions of software project risks –
- Team risk – turnover of staff, ramp-up time; lack of knowledge, cooperation, and motivation
- Organisational environment risk – politics, stability of organisation, management support
- Requirement risk – changes in requirements, incorrect and unclear requirements, and ambiguity
- Planning and control risk – unrealistic budgets, schedules; lack of visible milestones
- User risk – lack of user involvement, resistance by users
- Complexity risk – new technology, automating complex processes, tight coupling
Wallace et al. showed two interesting findings. Firstly, the overall project risk is directly correlated to the project performance – the higher the risk the lower the performance! Secondly, they found that even low risk projects have a high complexity risk.
Protecting Software Development Projects against Underestimation (Miranda & Abran, 2008)
Montag, November 3rd, 2008Miranda, Eduardo; Abran, Alain: Protecting Software Development Projects Against Underestimation; in: Project Management Journal, Vol. 39, No. 3, 7585.
DOI: 10.1002/pmj.20067
In this article Miranda & Abran argue „that project contingencies should be based on the amount it will take to recover from the underestimation, and not on the amount that would have been required had the project been adequately planned from the beginning, and that these funds should be administered at the portfolio level.“
Thus they propose delay funds instead of contingencies. The amount of that fund depends on the magnitude of recovery needed (u) and the time of recovery (t). t and u are described using a PERT-like model of triangular probability distribution, based on a best, most-likely, and worst case estimation.
The authors argue that typically in a software development three effects occur that lead to underestimation of contingencies. These three effects are (1) MAIMS behaviour, (2) use of contingencies, (3) delay.
MAIMS stands for ‚money allocated is money spent‘ – which means that cost overruns usually can not be offset by cost under-runs somewhere else in the project. The second effect is that contingency is mostly used to add resources to the project in order to keep the schedule. Thus contingencies are not used to correct underestimations of the project, i.e. most times the plan remains unchanged until all hope is lost. The third effect is that delay is an important cost driver, but delay is only acknowledged as late as somehow possible. This is mostly due to the facts of wishful thinking and inaction inertia on the project management side.
Tom DeMarco proposed a simple square root formula to express that staff added to a late project makes it even later. In this paper Miranda & Abran break this idea down into several categories to better estimate these effects.
In their model the project runs through three phases after delay occurred:
- Time between the actual occurence of the delay and when the delay is decided-upon
- Additional resources are being ramped-up
- Additional resources are fully productive
During this time the whole contingency needed can be broken down into five categories:
- Budgeted effort, which would occur anyway with delay or not = FTE * Recovery time as orginally planned
- Overtime effort, which is the overtime worked of the original staff after the delay is decided-upon
- Additional effort by additional staff, with a ramp-up phase
- Overtime contibuted by the additonal staff
- Process losses du to ramp-up, coaching, communication by orginal staff to the addtional staff
Their model also includes fatigue effects which reduce the overtime worked on the project, with the duration of that overtime-is-needed-period. Finally the authors give a numerical example.
A comprehensive model for selecting information system project under fuzzy environment (Chen & Cheng, in press)
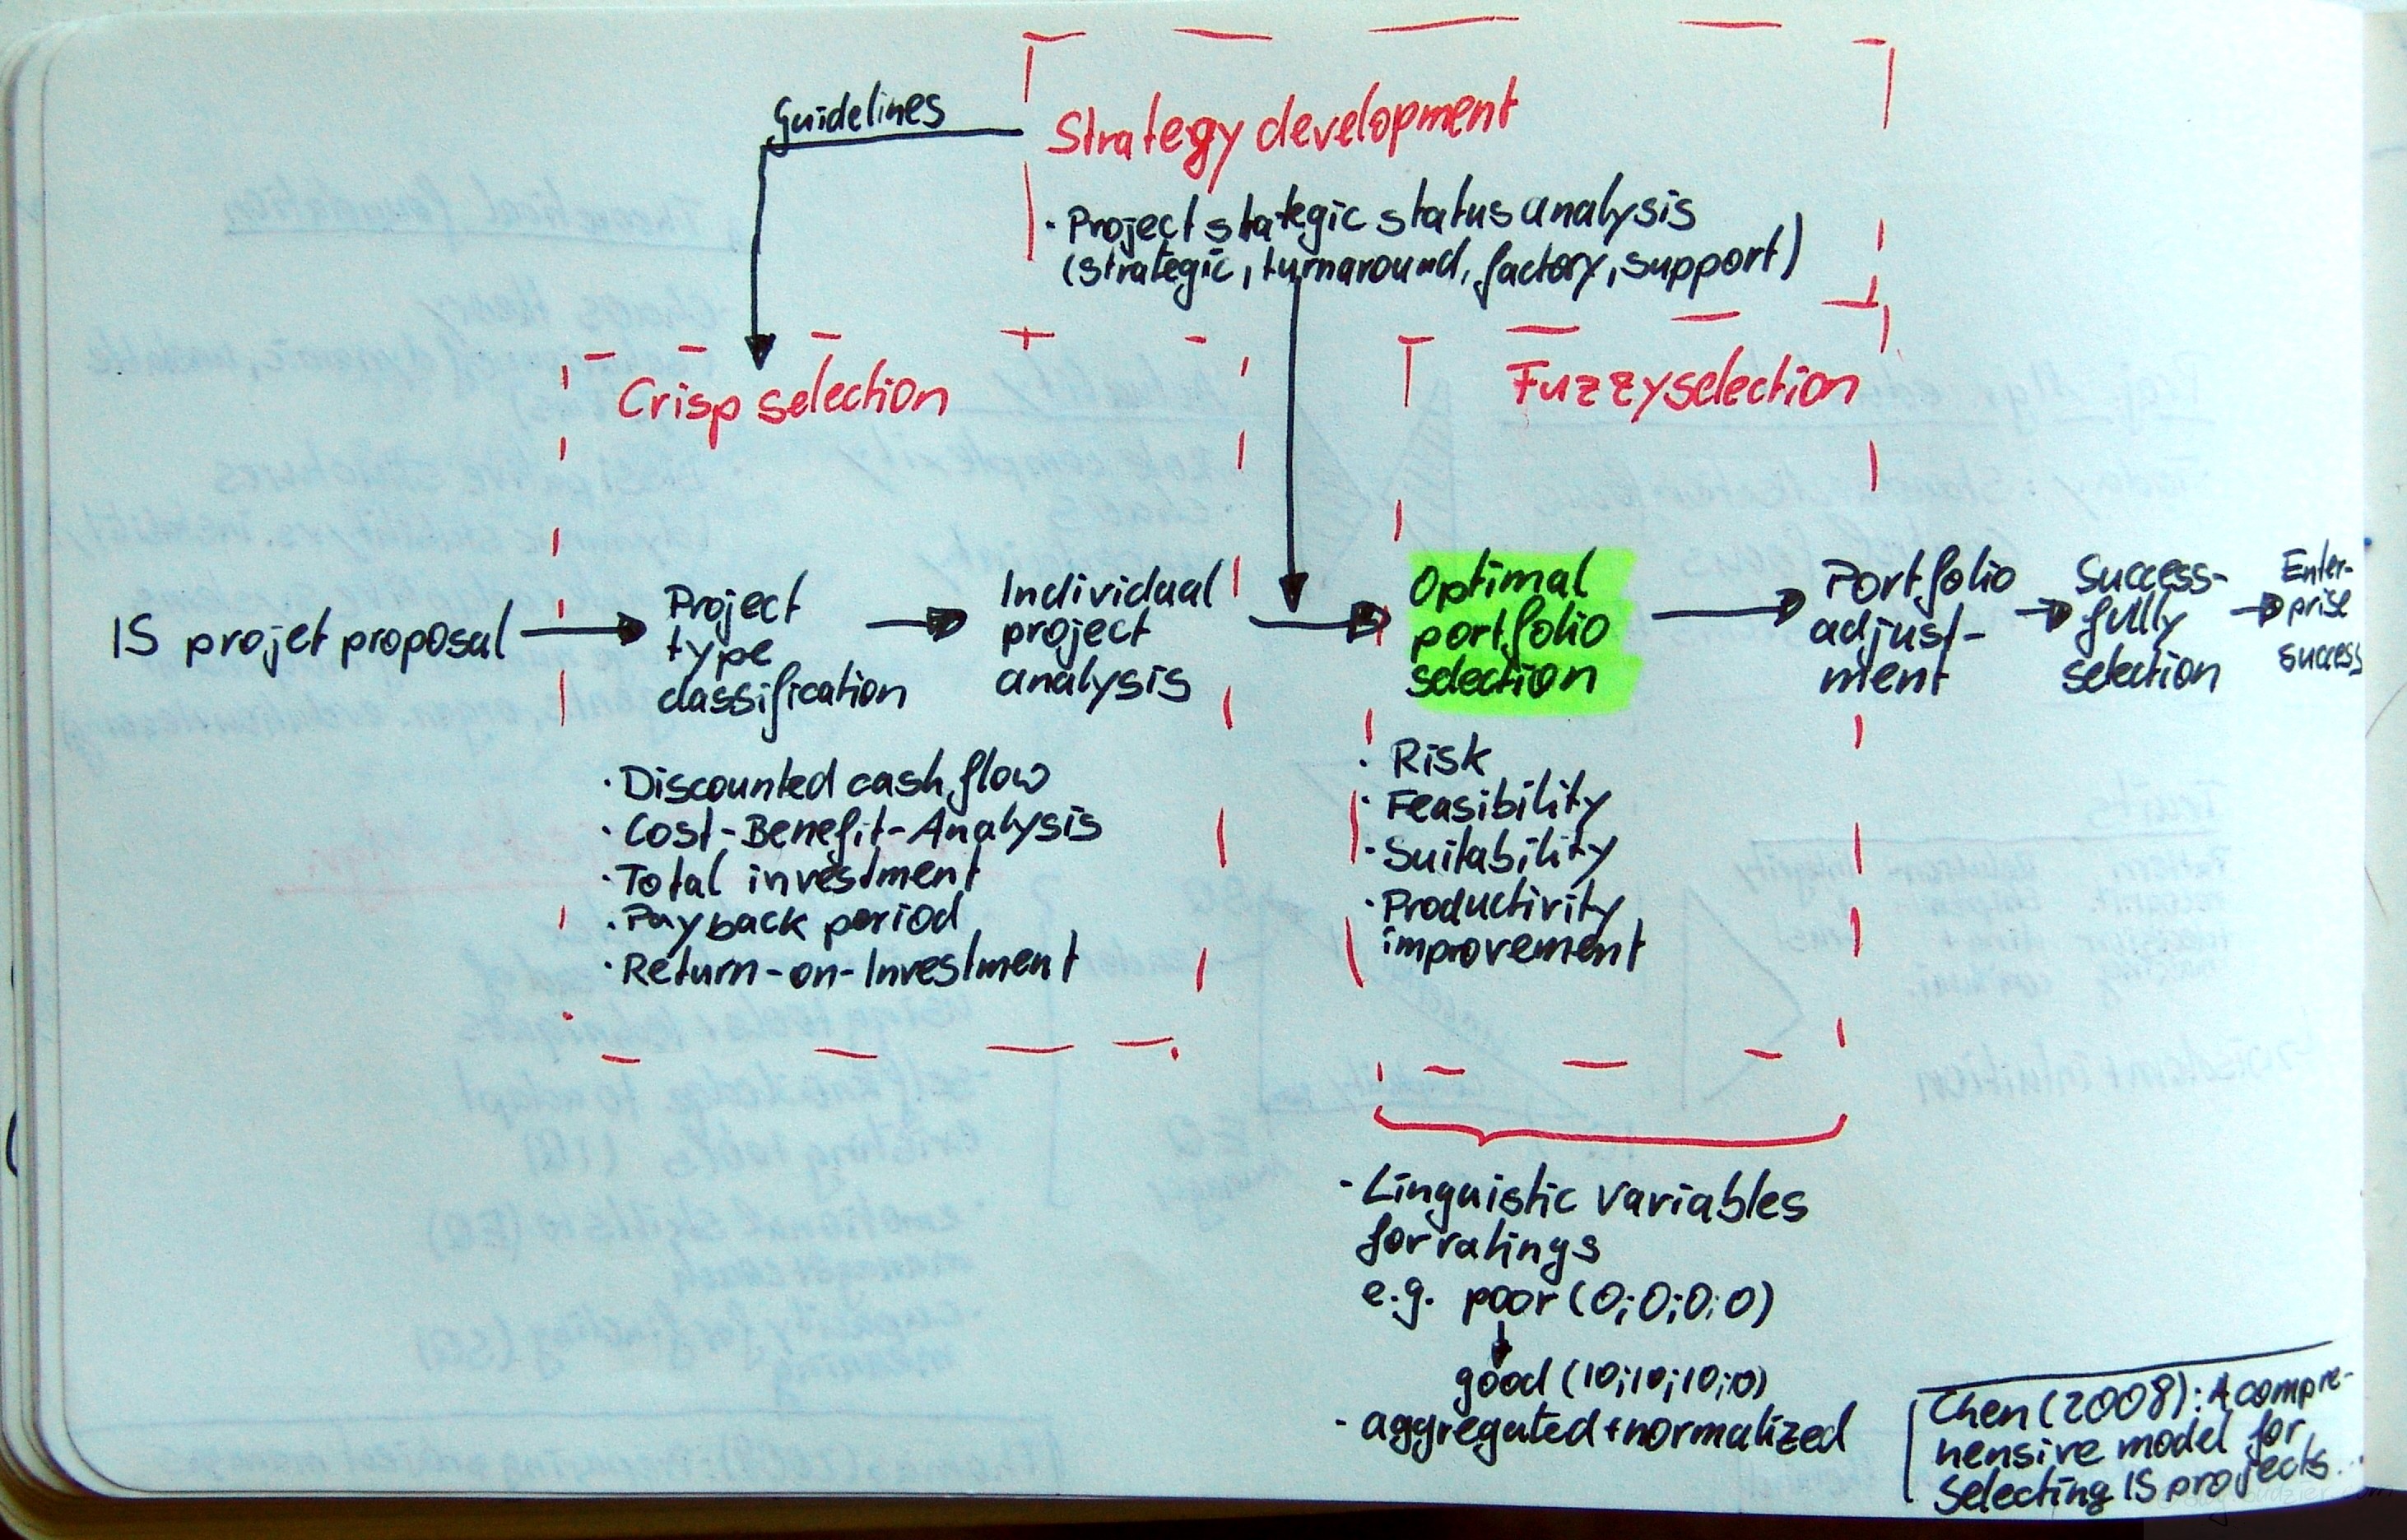
Dienstag, Oktober 7th, 2008 Chen, Chen-Tung; Cheng, Hui-Ling: A comprehensive model for selecting information system project under fuzzy environment; in: International Journal of Project Management, in press.doi:10.1016/j.ijproman.2008.04.001Update: this article has been published in: International Journal of Project Management Vol. 27 (2009), No. 4, pp. 389399.Upfront management is an ever growing body of research and currently develops into it’s own profession. In this article Chen & Cheng propose a model for the optimal IT project portfolio selection. They outline a seven step process from the IT/IS/ITC project proposal to the enterprise success
- IS/IT/ITC project proposal
- Project type classification
- Individual project analysis
- Optimal portfolio selection
- Portfolio adjustment
- Successfully selection
- Enterprise success
Behind the process are three different types of selection methods and tools – (1) crisp selection, (2) strategy development, and (3) fuzzy selection.The crisp selection is the first step in the project evaluation activities. It consists of different factual financial analyses, e.g. analysis of discounted cash flow, cost-benefits, total investment, payback period, and the return on investment.Strategy development is the step after the crisp selection, whilst it also impacts the first selection step by setting guidelines on how to evaluate the project crisply. Strategy development consists of a project strategic status analysis. According to Chen & Cheng’s framework a project falls in one of four categories – strategic, turnaround, factory, or support.The last step is the fuzzy selection. In this step typical qualitative characteristics of a project are evaluated, e.g., risk, feasibility, suitability, and productivity improvements. In this step lies the novelty of Chen & Cheng’s approach. They let the evaluators assign a linguistic variable for rating, e.g., from good to poor. Then each variable is translated into a numerical value, e.g., poor = 0, good = 10. As such, every evaluator produces a vector of ratings for each project, e.g., (0;5;7;2) – vector length depends on the number of characteristics evaluated. These vectors are then aggregated and normalised.[The article also covers an in-depth numerical example for this proposed method.]
Predicting Risk of Failure in Large-Scale Information Technology Projects (Willcocks & Griffiths, 1994)
Montag, August 11th, 2008Willcocks, Leslie; Griffiths, Catherine: Predicting Risk of Failure in Large-Scale Information Technology Projects; in: Technological Forecasting and Social Change, Vol. 47 (1994), No. 2, pp. 205-228.
Willcocks & Griffiths analyse risk management practice. They find that wrong tools are used, especially statistical and finance tools which create a false accuracy and are insufficient to set risks in the broader context they belong to. Thus risk management focuses on valuation of economical impacts instead of actively managing the risks themselves.
The authors analyse 6 well known ITC projects Singapore’s TradeNet (electronic data interchange (EDI) for all aspects of the flow of goods), UK’s Department of Social Security automation, India’s CRISP project (automate information collection and processing in India’s Integrated Rural Development program), Videotext (and it’s historical predecessor Minitel in France, Prestel in UK, and BTX in Germany), London Stock Exchange’s Taurus (automate trading, paperless dealing and contracting of shares).
Willcocks & Griffiths present their framework how to predict risk of failure of a large scale IT project more accurately. They develop a 3 step risk management approach (1) history & context, (2) process, and (3) risk outcomes.
History includes previous successes/failures, relevant experience and organizational assets. It also includes internal context, which is defined by characteristics of the organisation (e.g. strategy, structure, reward systems, HR, management), changing stakeholder needs and objectives, employee relations context, and IT infrastructure and management. Furthermore the first step analyses the external context which includes level of government support, environmental pressures, newness/maturity of technology, maturity of consultants/suppliers, and the market demand.
The second step is the project itself as characterised by its processes and content. The risk associated with the project’s content are driven by size, complexity, definitional and technical uncertainty, and the number of units involved. The process risks are influenced by governance structures, project management and succession, management support, user commitment, project time span, team experience, and staffing stability.
Risk outcomes can be described by cost, time, and technical performance. Moreover they include stakeholder benefits, organisational/national impacts, user/market acceptance, and usage of the final ITC deliverable.
A Framework for the Life Cycle Management of Information Technology Projects – ProjectIT (Stewart, 2008)
Donnerstag, Juli 17th, 2008Stewart, Rodney A.: A Framework for the Life Cycle Management of Information Technology Projects – ProjectIT; in: International Journal of Project Management, Vol. 26 (2008), pp. 203-212.
Stewart outlines a framework of management tasks which are set to span the whole life cycle of a project. The life cycle consists of 3 phases – selection (called „SelectIT“), implementation (called „ImplementIT“), and close-out (called „EvaluateIT“).
The first phase’s main goal is to single out the projects worth doing. Therefore the project manager evaluates cost & benefits (=tangible monetary factors) and value & risks (=intangible monetary factors). In order to evaluate these the project manager needs to define a probability function of these factors for the project. Then these distribution functions are aggregated. Stewart suggests using also the Analytical Hierarchy Process Method (AHP) and the Vertex method [which I am not familiar with, neither is wikipedia or the general internet] in this step. Afterwards the rankings for each project are calculated and the projects are ranked accordingly.
The second phase is merely a controlling view on the IT project implementation. According to Stewart you should conduct SWOT-Analyses, come up with a IT diffusion strategy, design the operational strategy, some action plans on how to implement IT, and finally a monitoring plan.
The third stage („EvaluateIT“) advocates the use of an IT Balanced Score Card with 5 different perspectives – (1) Operations, (2) Benefits, (3) User, (4) Strategic competitiveness, and (5) Technology/System. In order to establish the Balanced Score Card measures for each category need to be defined first, then weighted, then applied and measured. The next step is to develop a utility function and finally overall IT performance can be monitored and improvements can be tracked.
Project management of unexpected events (Söderholm, 2007)
Donnerstag, Juli 17th, 2008Söderholm, Anders: Project management of unexpected events; in: International Journal of Project Management, Vol. 26 (2007), No. 1, pp. 80-86.
http://dx.doi.org/10.1016/j.ijproman.2007.08.016
Söderholm qualitatively studies in four cases how unexpected events are dealt with on projects. The author finds three most common root causes for unexpected events, re-openings of topics (mostly due to outside pressure, e.g., new definitions, new issues, politics), revisions of plans, and fine tuning of the project. Furthermore Söderholm identifies four different tactics to manage unexpected events. (1) innovative action, (2) applying detachment strategies, (3) setting up intensive meeting schedules, and (4) negotiating project conditions.
ad (1) – Innovative action is an inside, short term action to counter the event, examples for this action are the shuffling of resources, delaying activities, and problem solving
ad (2) – Detachment strategies are typical MaxiMin-strategies, the project tries to make itself independent from the event’s consequences as much as possible
ad (3) – Intensive meeting schedules are set up to closely monitor a problematic work package of the project and to assure the best communication flow possible
ad (4) – Negotiating conditions and project safe guarding are mostly used by project managers to gain access to additional resources
Managing Knowledge and Learning in IT Projects: A Conceptual Framework and Guidelines for Practice (Reich, 2007)
Dienstag, Juli 15th, 2008Reich, Blaize Horner: Managing Knowledge and Learning in IT Projects – A Conceptual Framework and Guidelines for Practice; in: Project Management Journal, Vol. 38 (2007), No. 2, pp. 5-17.
This paper won the PMI award for the best paper in 2007. She identifies 10 risks on the projects which arise due to knowledge gaps. Reich structures the risks from a systems and process perspective. Risks 1&2 are project inputs, Risks 3&4 are linked to the project governance, Risks 5-8 are operational risks, Risk 10 is an output risk.
- Previous lessons are not learned
- Team selection is flawed
- Volatility in the governance team
- Lack of role knowledge
- Inadequate knowledge integration
- Incomplete knowledge transfer
- Exit of team members
- Lack of knowledge map
- Loss between phases
- Failure to learn
Since learning the way to bridge knowledge gaps, Reich concludes that the best way to address the risks is 4-fold (1) establish a learning climate, (2) establish and maintain knowledge levels, (3) create channels for knowledge flow, and (4) develop a team memory.
Managing incomplete Knowledge (Pender, Steven 2001)
Mittwoch, Juli 2nd, 2008Pender, Steven: Managing incomplete knowledge – Why risk management is not sufficient, in: International Journal of Project Management, Vol. 19 (2001), pp. 79-87.
Pender basically looks into the question if project risks is better described by the term ‚incomplete knowledge‘ and therefore be linked to probability theory. (Kudos to everyone who did the PMP and still knows which contingency reserve accounts for ‚known unknowns‘ and which for ‚unknown unknowns‘.)
He looks into the question of randomness (probability vs. non-probability), repeatability, human limitations to understand such a complex thing as a project, uncertainty & ignorance, flow of knowledge, and fuzziness of parameters.


