Archive for the ‘Portfolio Management’ Category

Research Featured in Harvard Business Review

Donnerstag, Juli 26th, 2012

After 2 years of researching ICT projects the on-going research has been picked up by the Harvard Business Review and is on the cover of their September 2011 issue.

„Why your IT projects may be riskier than you think?“

By now, I collected a database of nearly 1,500 IT projects – in short we argue that the numbers in the hotly debated Standish Report are wrong, but their critics don’t get it quite right either. We found that while IT projects perform reasonably well on average the risk distribution has very fat tails in which a lot of Black Swan Events hide. 1 in 6 IT projects turned into a Black Swan – an event that can take down companies and cost executives their jobs.

Enjoy the read!

More background reading on the HBR article can be found in this working paper.

The resource allocation syndrome (Engwall & Jerbant, 2003)

Mittwoch, April 22nd, 2009

DSC02120

Engwall, Mats; Jerbant, Anna: The resource allocation syndrome – the prime challenge of multi-project management?; in: International Journal of Project Management, Vol. 21 (2003), No. 6, pp. 403-409.
http://dx.doi.org/10.1016/S0263-7863(02)00113-8

Engwall & Jerbant analyse the nature of organisations, whose operations are mostly carried out as simultaneous or successive projects. By studying a couple of qualitative cases the authors try to answer why the resource allocation syndrome is the number one issue for multi-project management and which underlying mechanisms are behind this phenomenon.

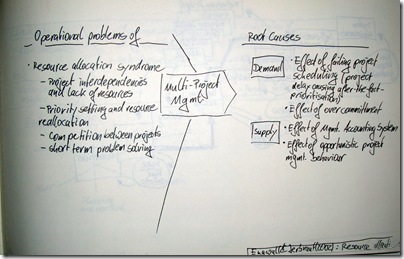
The resource allocation syndrome is at the heart of operational problems in multi-project management, it’s called syndrome because multi-project management is mainly obsessed with front-end allocation of resources.  This shows in the main characteristics: projects have interdependencies and typically lack resources; management is concerned with priority setting and resources re-allocation; competition arises between the projects; management focuses on short term problem solving.

The root causes for these syndromes can be found on both the demand and the supply side.  On the demand side the two root causes identified are the effect of failing projects on the schedule, the authors observed that project delay causes after-the-fact prioritisation and thus makes management re-active and rather unhelpful; and secondly over commitment cripples the multi-project-management.

On the supply side the problems are caused by management accounting systems, in this case the inability to properly record all resources and projects; and effect of opportunistic management behaviour, especially grabbing and booking good people before they are needed just to have them on the project.

Project portfolio management – There’s more to it than what management enacts (Blichfeldt & Eskerodt, 2008)

Donnerstag, Oktober 23rd, 2008

Project portfolio management – There’s more to it than what management enacts (Blichfeldt & Eskerodt, 2008)

Blichfeldt, Bodil Stilling; Eskerod, Pernille: Project portfolio management – There’s more to it than what management enacts; in: International Journal of Project Management, Vol. 26 (2008), No. 4, pp. 357-365.
http://dx.doi.org/10.1016/j.ijproman.2007.06.004

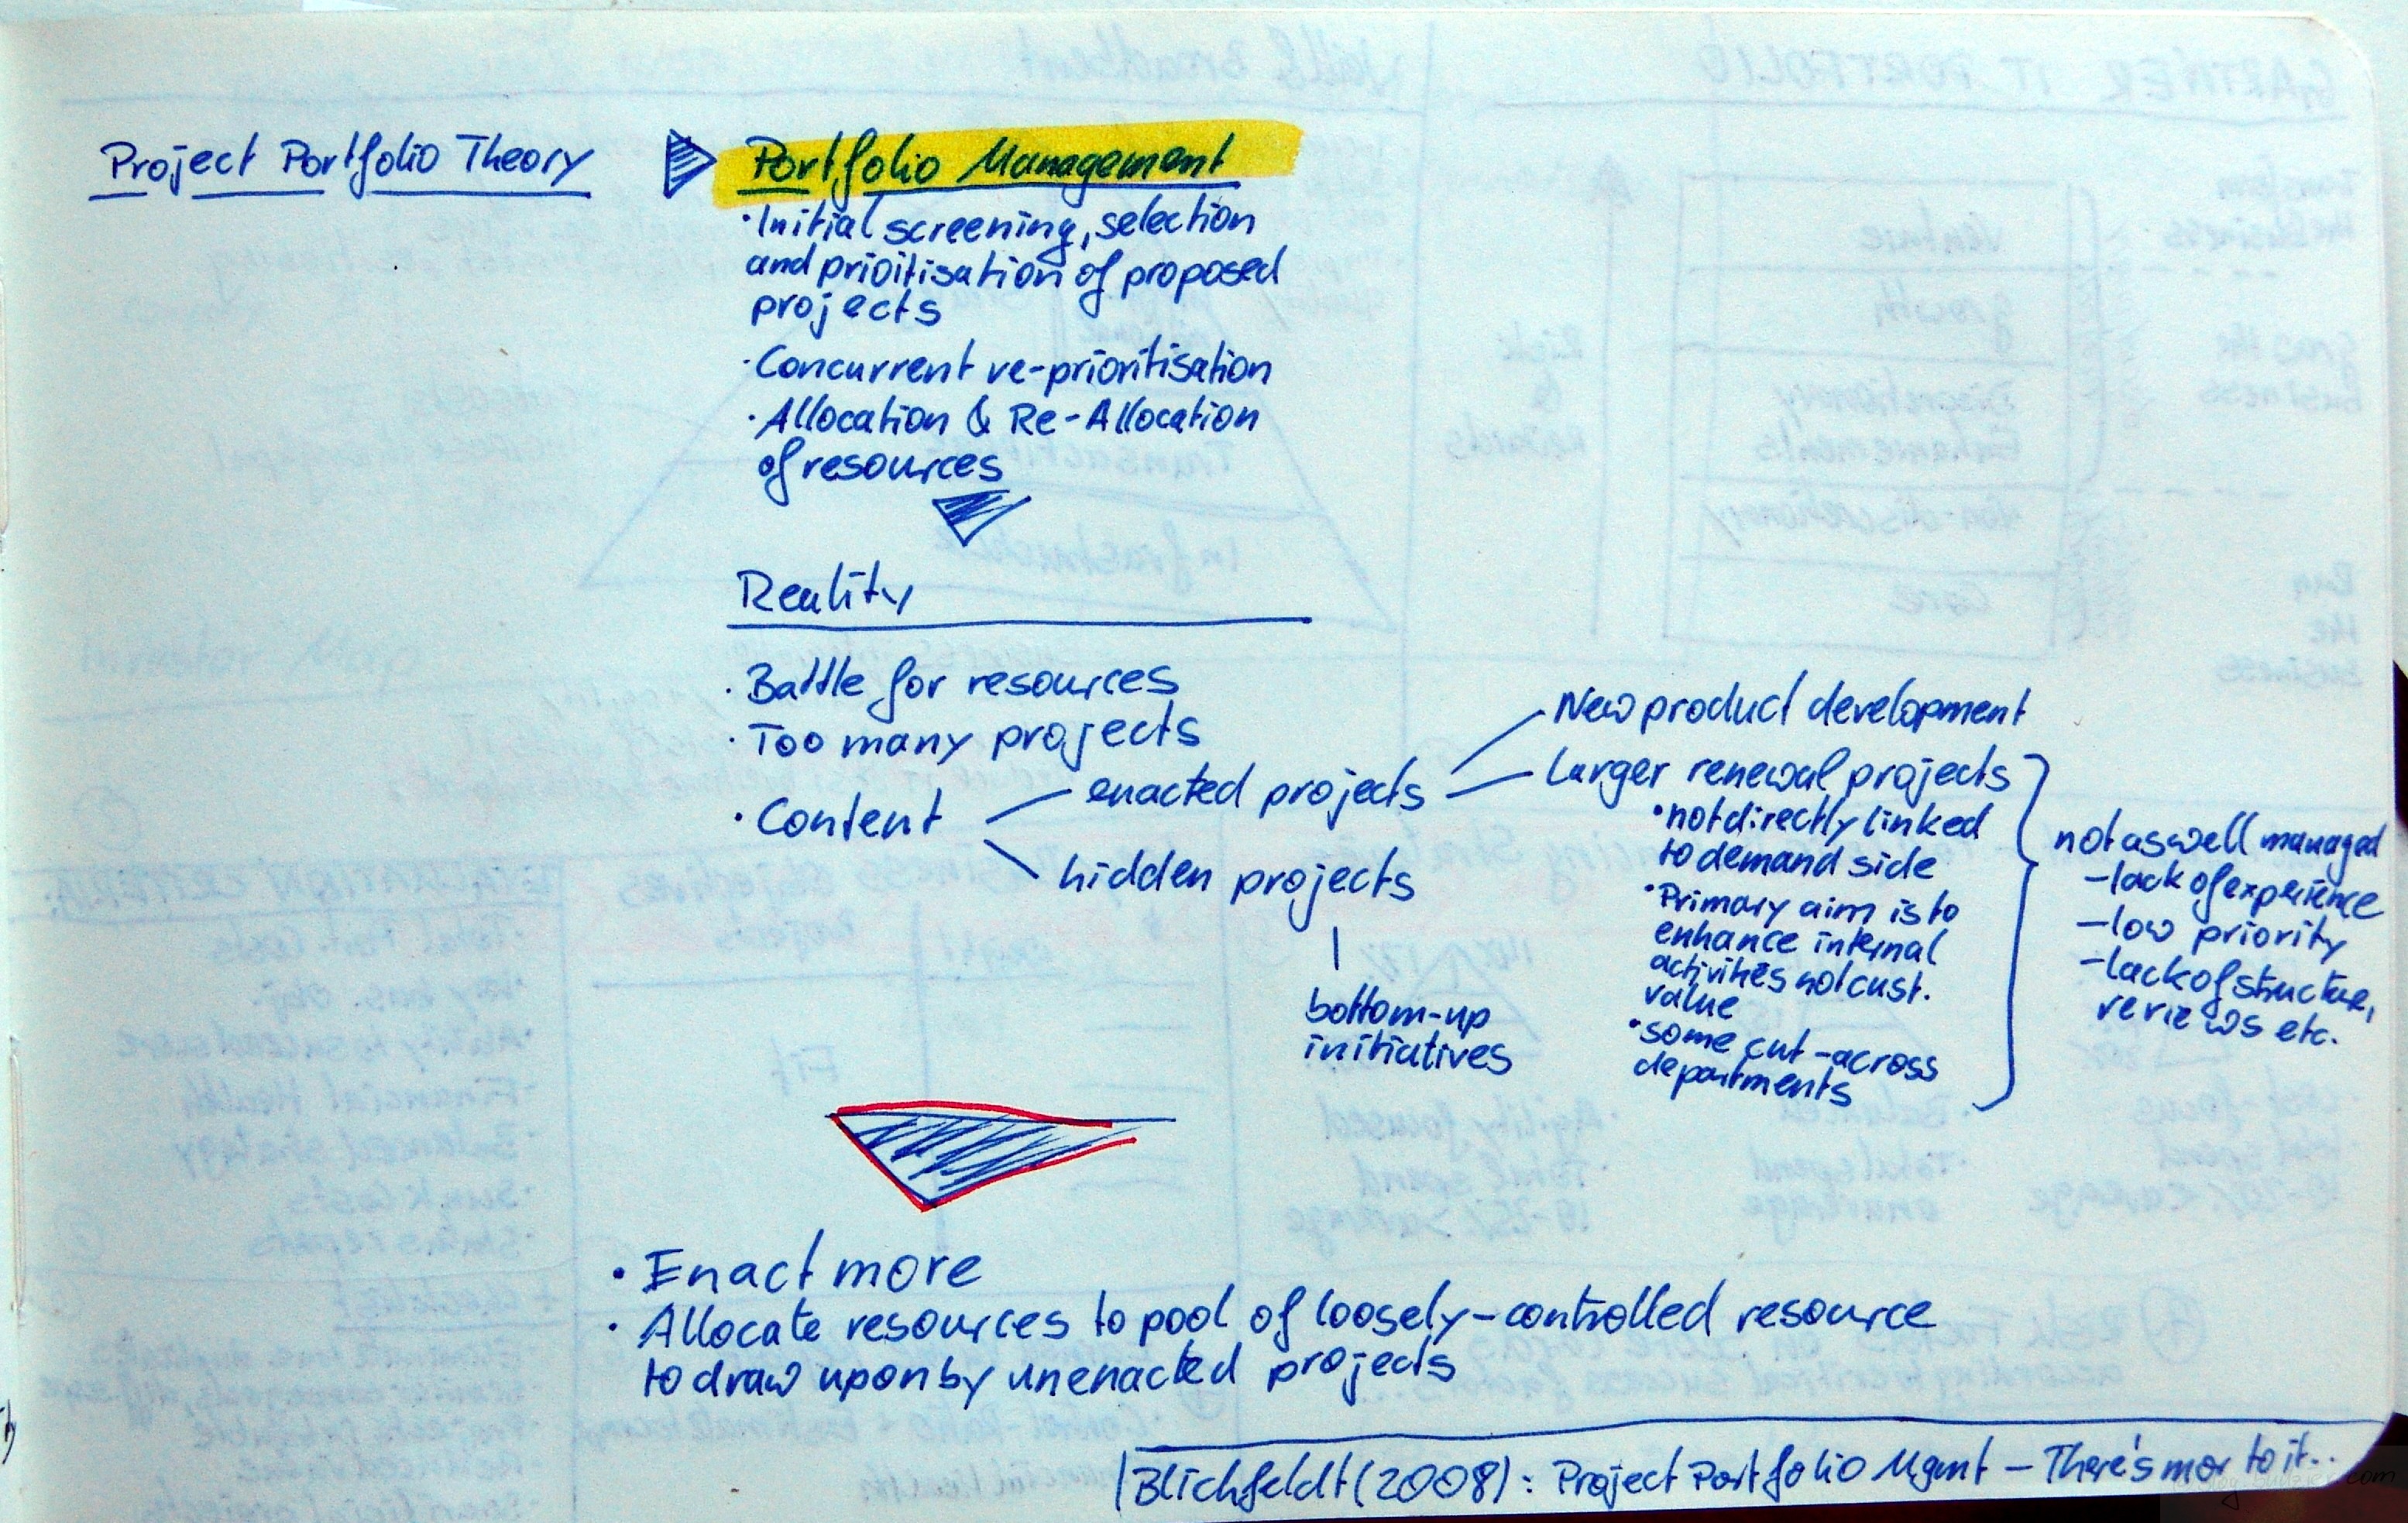
Project Portfolio Management in Theory consists of

  • Initial screening, selection, and prioritisation of proposed projects
  • Concurrent re-prioritisation
  • Allocation and re-allocation of resources

These activities are free of any value. Blichfeldt & Eskerodt analyse the reality of project portfolio management to find out if it does any good to the organisations it is used in.

In reality they find that project portfolio management is merely a battle for resources and that portfolios consist of way to many projects to be practically manageable. He finds two distinct categories of projects in a portfolio – (1) enacted projects and (2) hidden projects.

Among the enacted projects are typically the new product developments, the classic project, trimmed for successful launch of a new cash cow. But in this enacted project category there are also the larger renewal projects. The larger renewal projects are usually not directly linked to the demand side, their primary aim is to enhance internal activities and not customer value, and some of them cut across departments. Overall the large renewal projects are not as well managed as product development projects – they lack experience, have a low priority, and lack structure, reviews etc.

The second category are the hidden projects. Usually bottom-up initiatives, departments or even single persons start during their work hours, or in specifically allocated time to pursue innovative projects of own interest.

Blichfeldt & Eskerod recommend to enact more projects. Manage the larger renewal projects in a more structured way, and include the hidden projects into the portfolio. If they drain resources they must be managed. Without destroying the creativity and innovation that usually come from these grass-root projects, organisations should allocate resources to a pool of loosely-controlled resources. Unenacted projects should be allowed to draw resources from this pool, with minimal administrative burden.

An experimental investigation of factors influencing perceived control over a failing IT project (Jani, 2008)

Montag, Oktober 20th, 2008

An experimental investigation of factors influencing perceived control over a failing IT project (Jani, 2008)

Jani, Arpan: An experimental investigation of factors influencing perceived control over a failing IT project; in: International Journal of Project Management, Vol. 26 (2008), No. 7, pp. 726-732.
http://dx.doi.org/10.1016/j.ijproman.2008.06.004

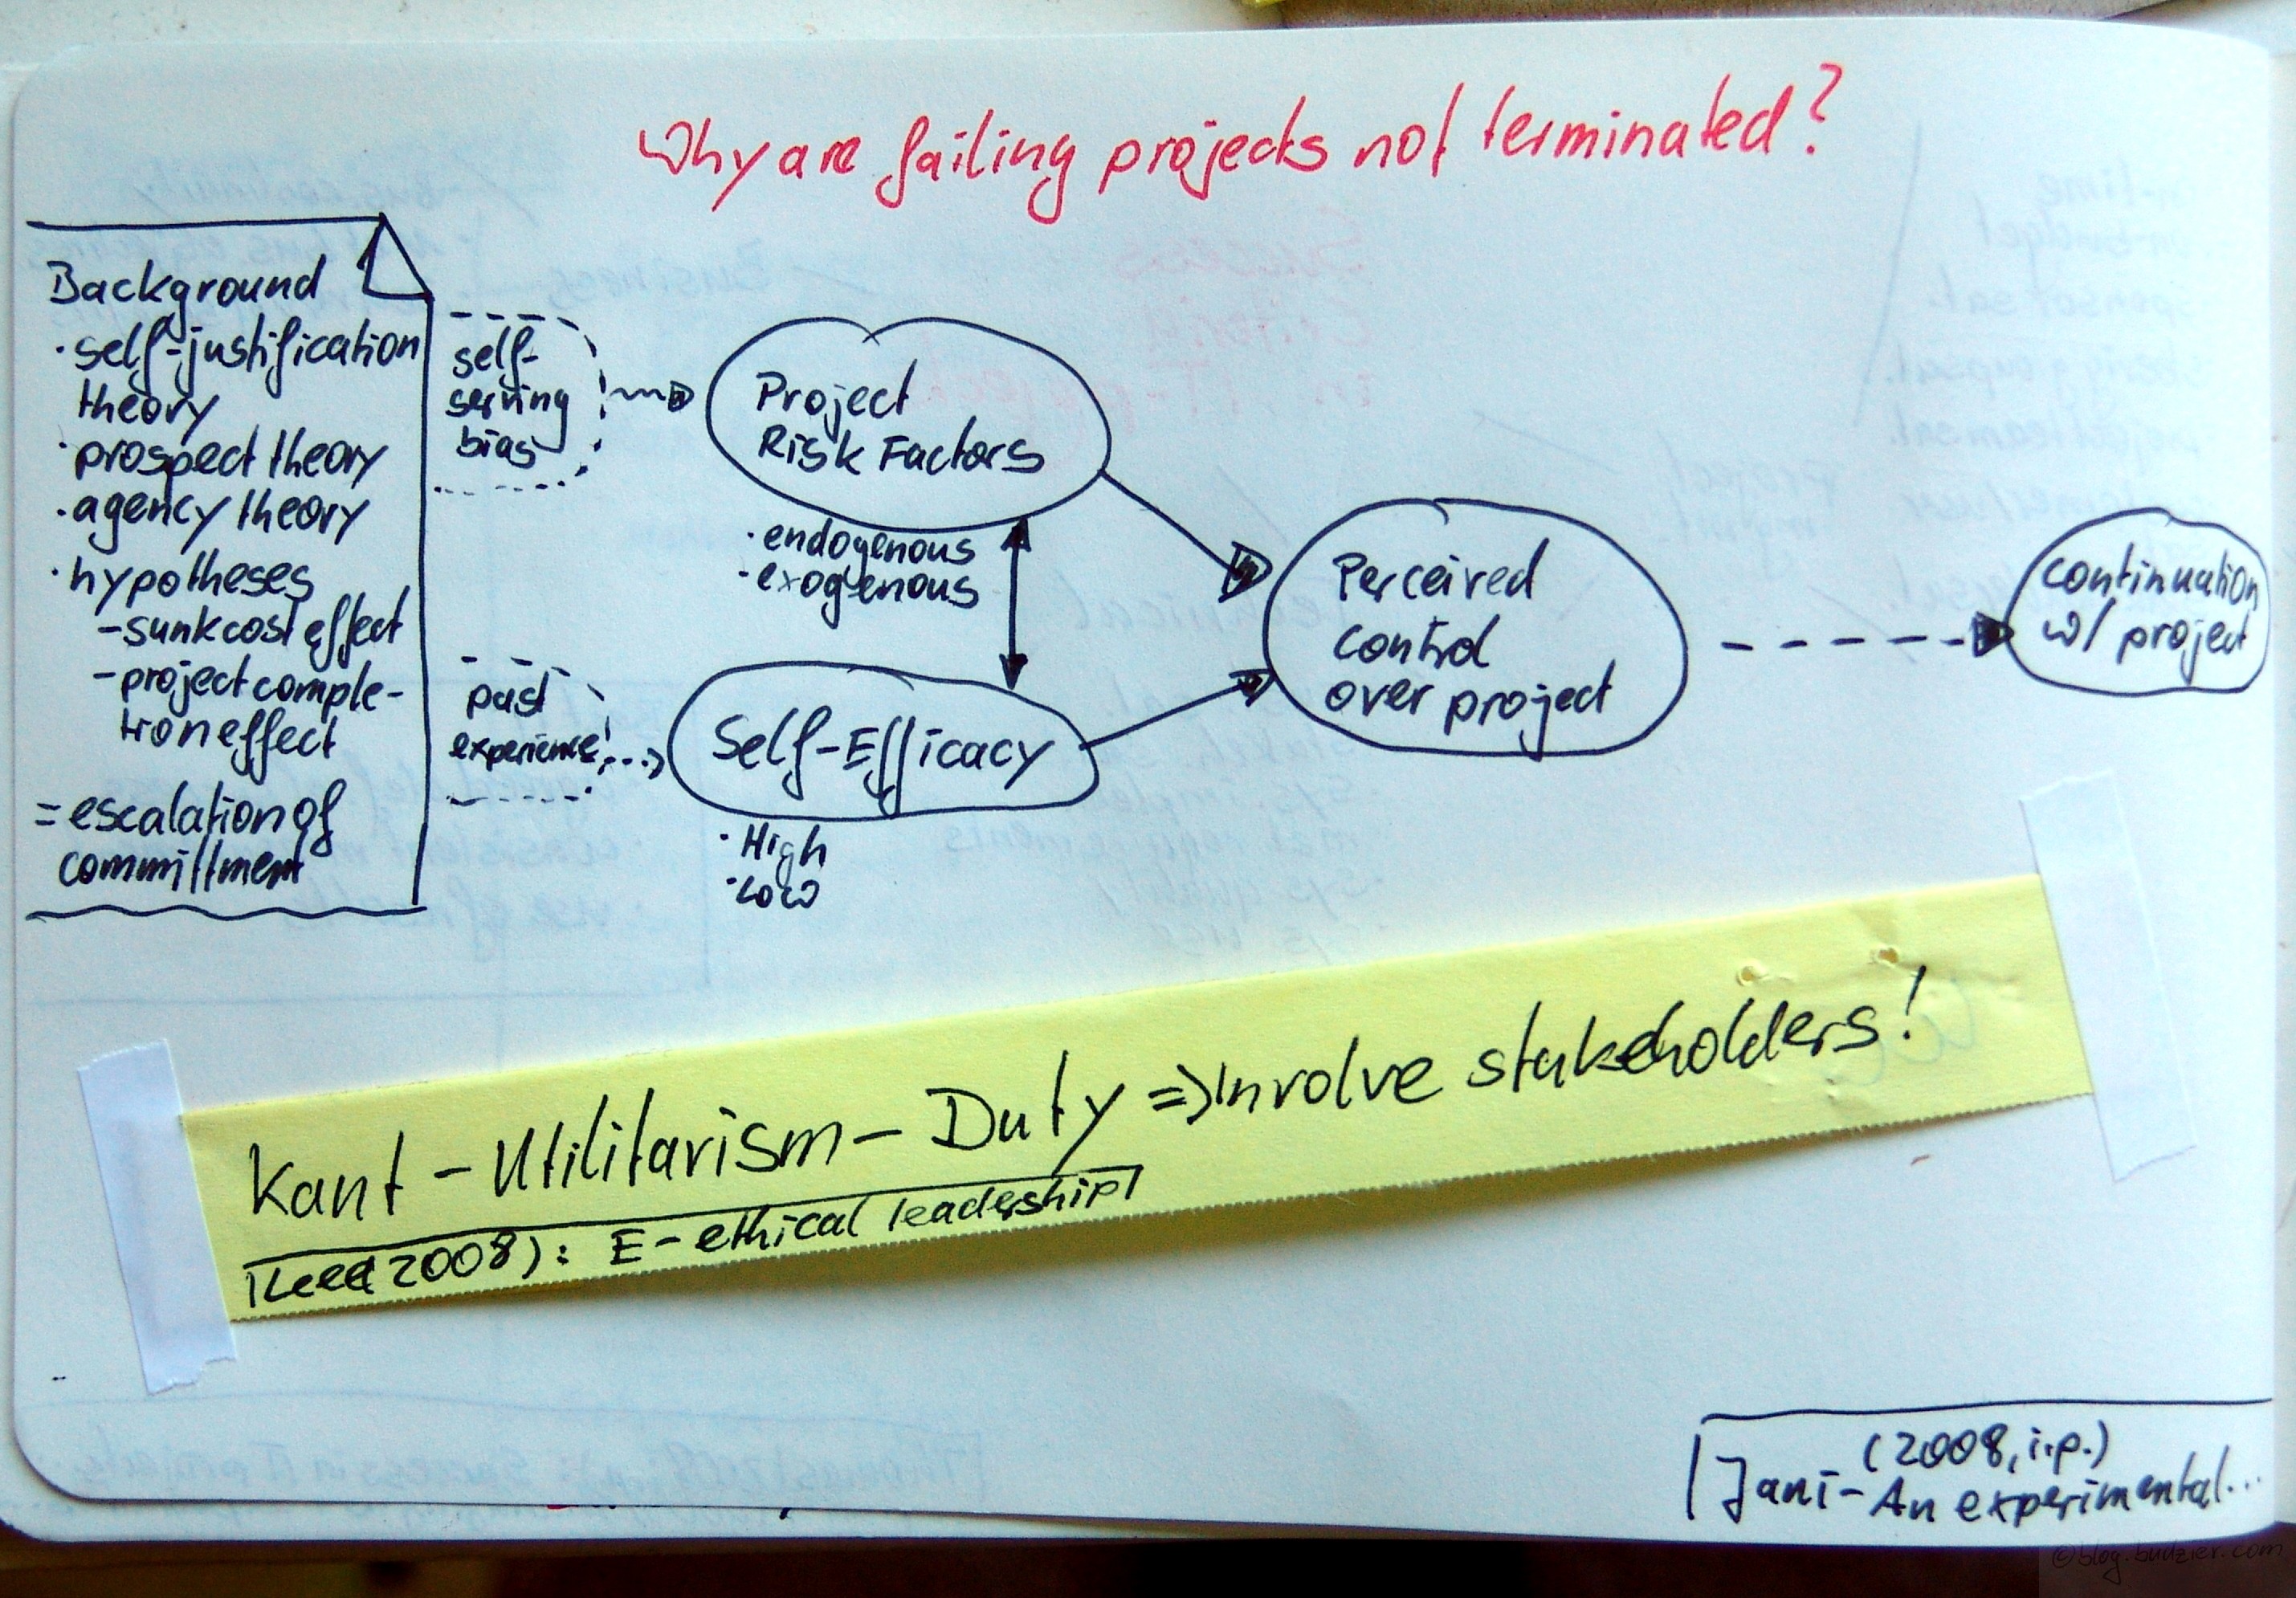
Jani wants to analyse why failing projects are not terminated, a spiralling development also called escalation of commitment (I posted about a case discussion of the escalation of commitment on the TAURUS project).  Jani performed a computer simulated experiment to show the antecedents of a continuation decision.

He rooted the effect of escalating commitment on the self-justification theory, prospect theory, agency theory, and also on sunk cost effects & project completion effects.

Self-justification motivates behaviour to justify attitudes, actions, beliefs, and emotions. It is an effect of cognitive dissonance and an effective cognitive strategy to reduce the dissonance. An example for this behaviour is continuing with a bad behaviour, because stopping it would question the previous decision (= escalation of commitment).

Another example is bribery. People bribed with a large amount of money, tend not to change their attitudes, which were unfavourable otherwise there was nor reason to bribe them in the first place. But Festinger & Carlsmith reported that bribery with a very small amount of money, made people why they accepted the bribe although it had been that small, thus thinking that there must be something to it and changing their attitude altogether. Since I did it, and only got 1 Dollar is a very strong dissonance. Here is a nice summary about their classic experiments. Here is one of their original articles.

Jani argues that all these theoretical effects fall into two factors – (1) self-serving bias and (2) past experience. These influence the judgement on his two antecedents – (1) project risk factors (endogeneous and exogeneous) and (2) task specific self-efficacy. The latter is measured as a factor step high vs. low and describes how you perceive your capability to influence events that impact you (here is a great discussion of this topic by Bandura).

The two factors of project risk and task specific self-efficacy then influence the perceived control over the project which influences the continuation decision. Jani is able to show that task specific self-efficacy moderates the perceived project control. In fact he manipulated the project risks to simulate a failing projects, at no time participants had control over the outcome of their decisions. Still participants with a higher self-efficacy judged their perceived control significantly higher than participants with lower self-efficacy. This effect exists for engogenous and exogenous risk factors alike.

The bottom-line of this experiment is quite puzzling. A good project manager, who has a vast track record of completing past projects successfully, tends to underestimate the risks impacting the project. Jani recommends that even with great past experiences on delivering projects, third parties should always review project risks. Jani asks for caution using this advice since his experiment did not prove that joint evaluation corrects for this bias effectively.

Lee, Margaret E.: E-ethical leadership for virtual project teams; in: International Journal of Project Management, in press (2008).
http://dx.doi.org/10.1016/j.ijproman.2008.05.012

I quickly want to touch on this article, since the only interesting idea which stroke me was that Lee did draw a line from Kant to Utilitarism to the notion of Duty. She then concludes that it is our Kantesian, Utalitarian duty to involve stakeholders.

A comprehensive model for selecting information system project under fuzzy environment (Chen & Cheng, in press)

Dienstag, Oktober 7th, 2008

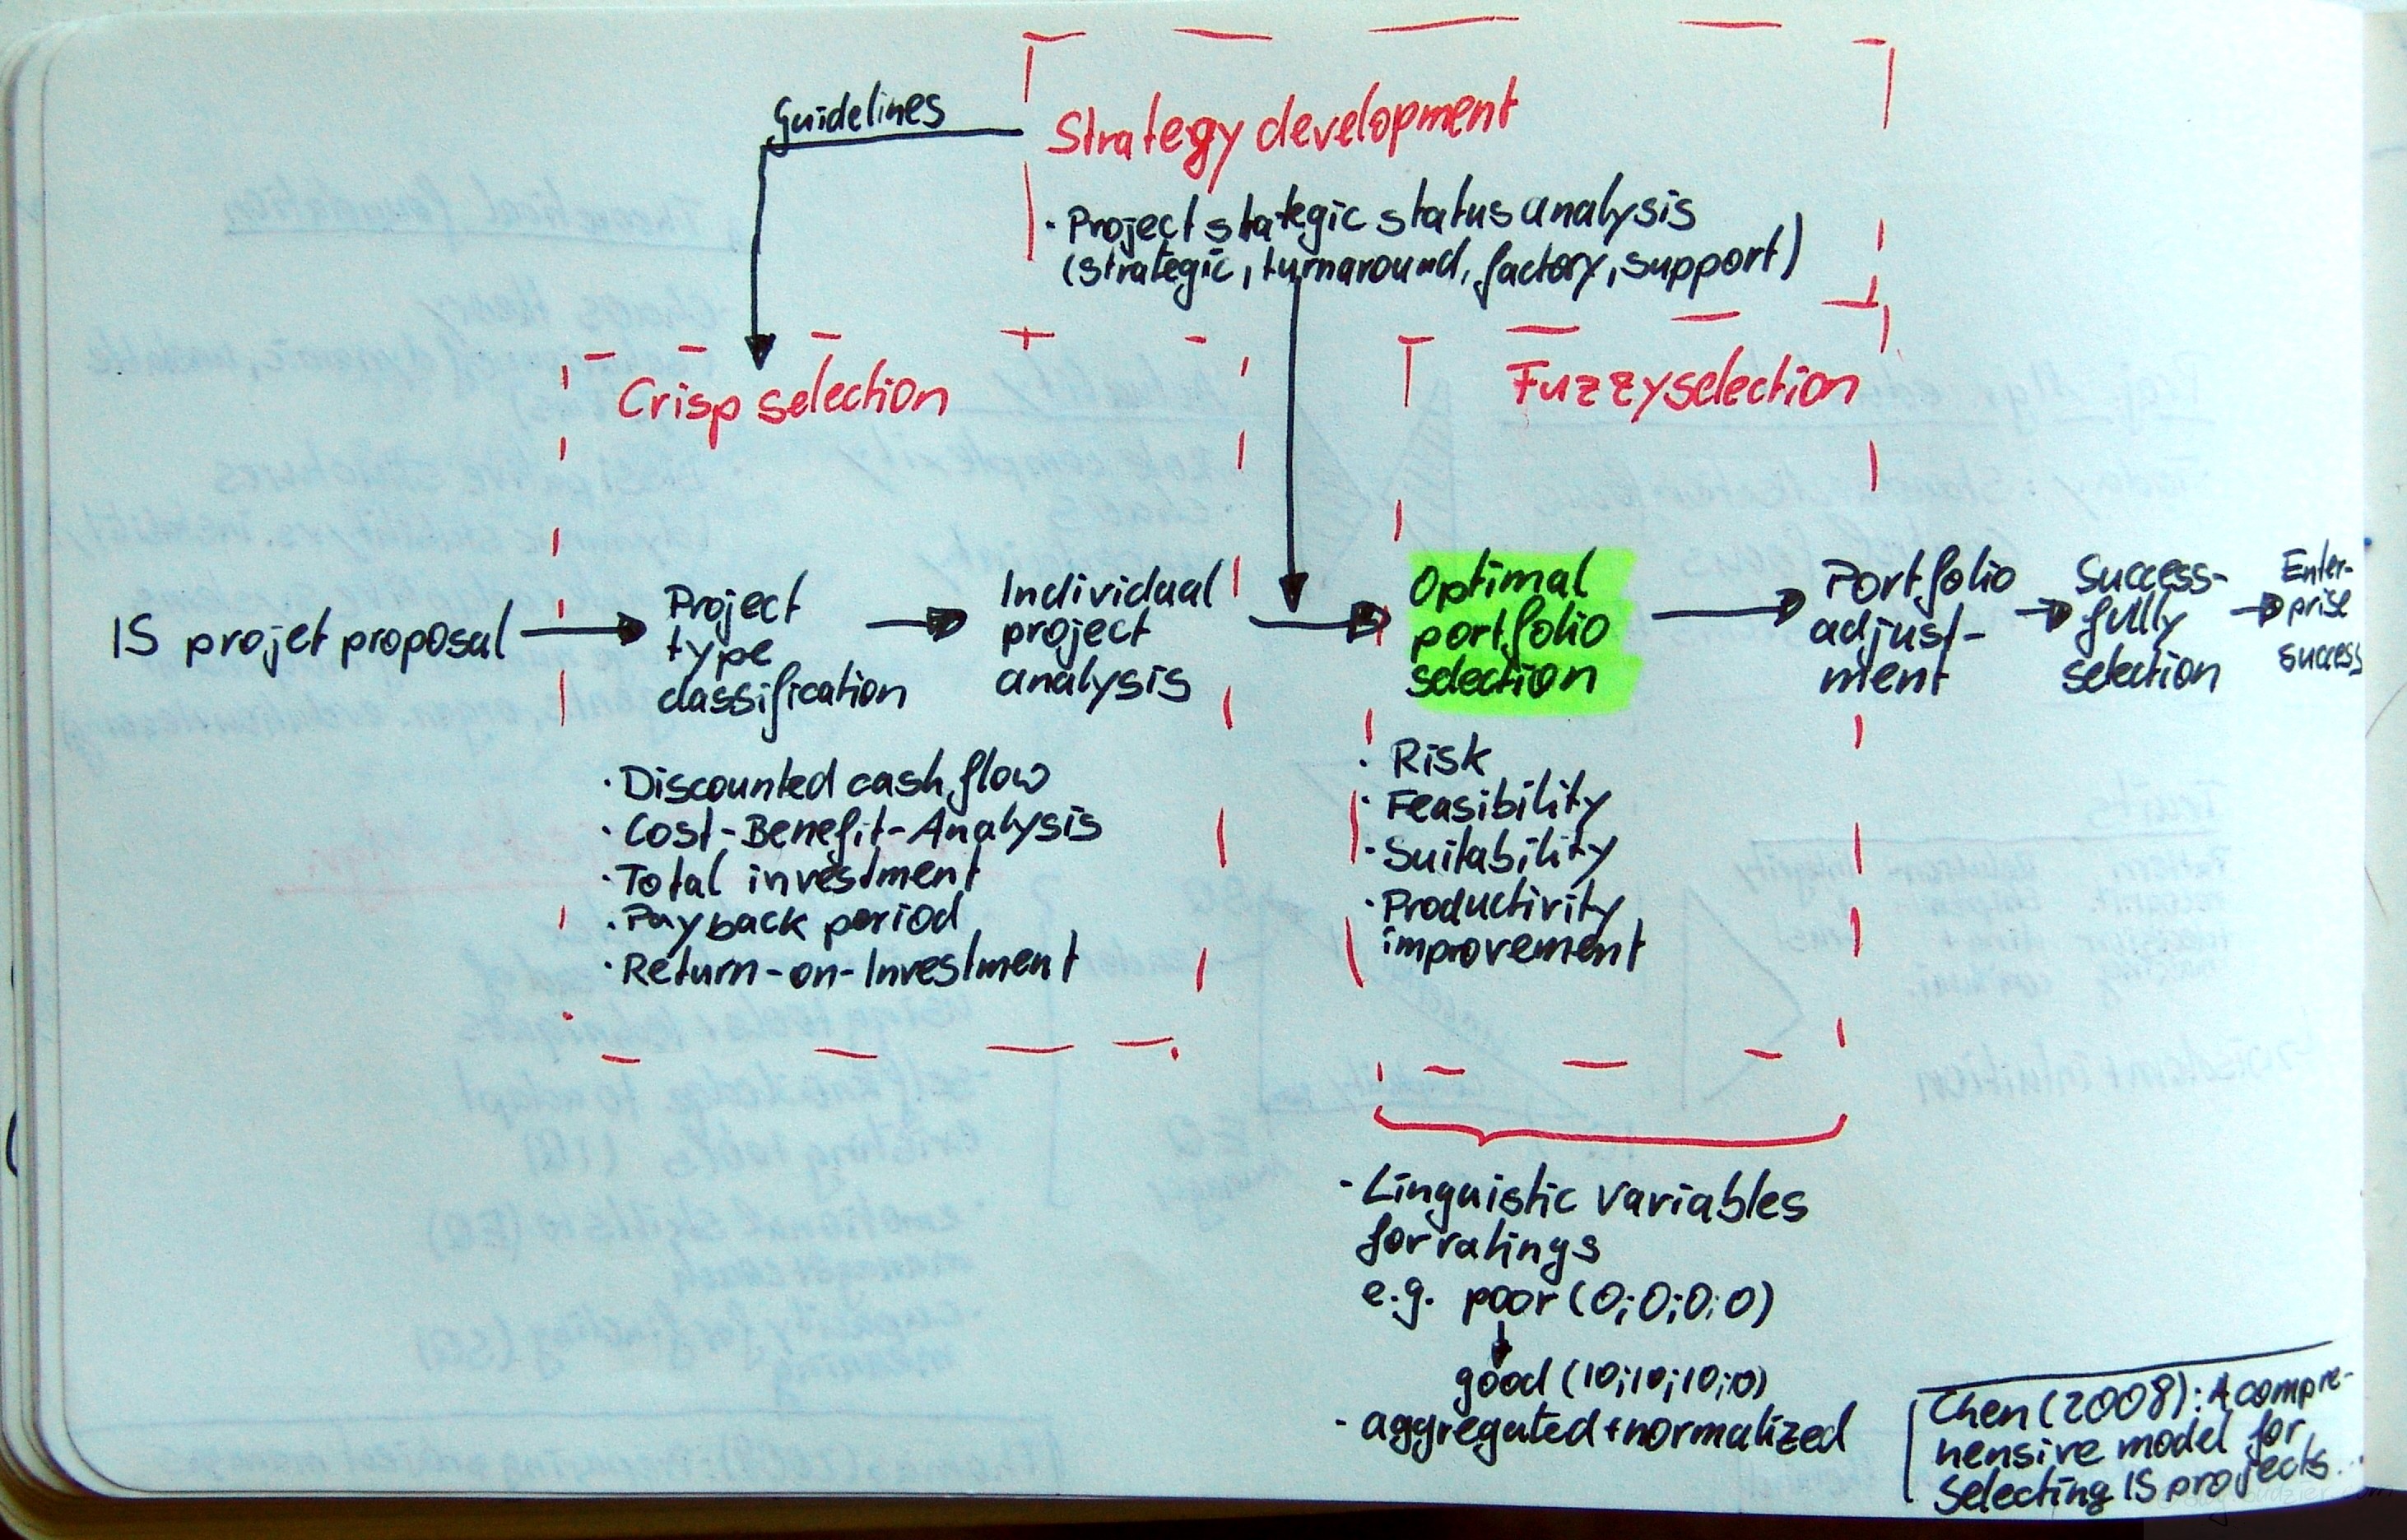
A comprehensive model for selecting information system project under fuzzy environment (Chen & Cheng, in press)Chen, Chen-Tung; Cheng, Hui-Ling: A comprehensive model for selecting information system project under fuzzy environment; in: International Journal of Project Management, in press.doi:10.1016/j.ijproman.2008.04.001Update: this article has been published in:  International Journal of Project Management Vol. 27 (2009), No. 4, pp. 389–399.Upfront management is an ever growing body of research and currently develops into it’s own profession. In this article Chen & Cheng propose a model for the optimal IT project portfolio selection. They outline a seven step process from the IT/IS/ITC project proposal to the enterprise success

  1. IS/IT/ITC project proposal
  2. Project type classification
  3. Individual project analysis
  4. Optimal portfolio selection
  5. Portfolio adjustment
  6. Successfully selection
  7. Enterprise success

Behind the process are three different types of selection methods and tools – (1) crisp selection, (2) strategy development, and (3) fuzzy selection.The crisp selection is the first step in the project evaluation activities. It consists of different factual financial analyses, e.g. analysis of discounted cash flow, cost-benefits, total investment, payback period, and the return on investment.Strategy development is the step after the crisp selection, whilst it also impacts the first selection step by setting guidelines on how to evaluate the project crisply. Strategy development consists of a project strategic status analysis. According to Chen & Cheng’s framework a project falls in one of four categories – strategic, turnaround, factory, or support.The last step is the fuzzy selection. In this step typical qualitative characteristics of a project are evaluated, e.g., risk, feasibility, suitability, and productivity improvements. In this step lies the novelty of Chen & Cheng’s approach. They let the evaluators assign a linguistic variable for rating, e.g., from good to poor. Then each variable is translated into a numerical value, e.g., poor = 0, good = 10. As such, every evaluator produces a vector of ratings for each project, e.g., (0;5;7;2) – vector length depends on the number of characteristics evaluated. These vectors are then aggregated and normalised.[The article also covers an in-depth numerical example for this proposed method.]

A multicriteria satisfaction analysis approach in the assessment of operational programmes (Ipsilandis et al., 2008)

Montag, September 22nd, 2008

A multicriteria satisfaction analysis approach in the assessment of operational programmes (Ipsilandis et al., 2008)

Ipsilandis, Pandelis G.; Samaras, George; Mplanas, Nikolaos: A multicriteria satisfaction analysis approach in the assessment of operational programmes; in: International Journal of Project Management, Vol. 26 (2008), No. 6, pp. 601-611.
http://dx.doi.org/10.1016/j.ijproman.2007.09.003

Satisfaction measurement was one of my big things for a long time, when I was still working in market research. I still believe in the managerial power of satisfaction measurements, although you might not want to do it every 8 weeks rolling. Well, that’s another story and one of these projects where a lot of data is gathered for no specific decision-making purpose and therefore the data only sees limited use.

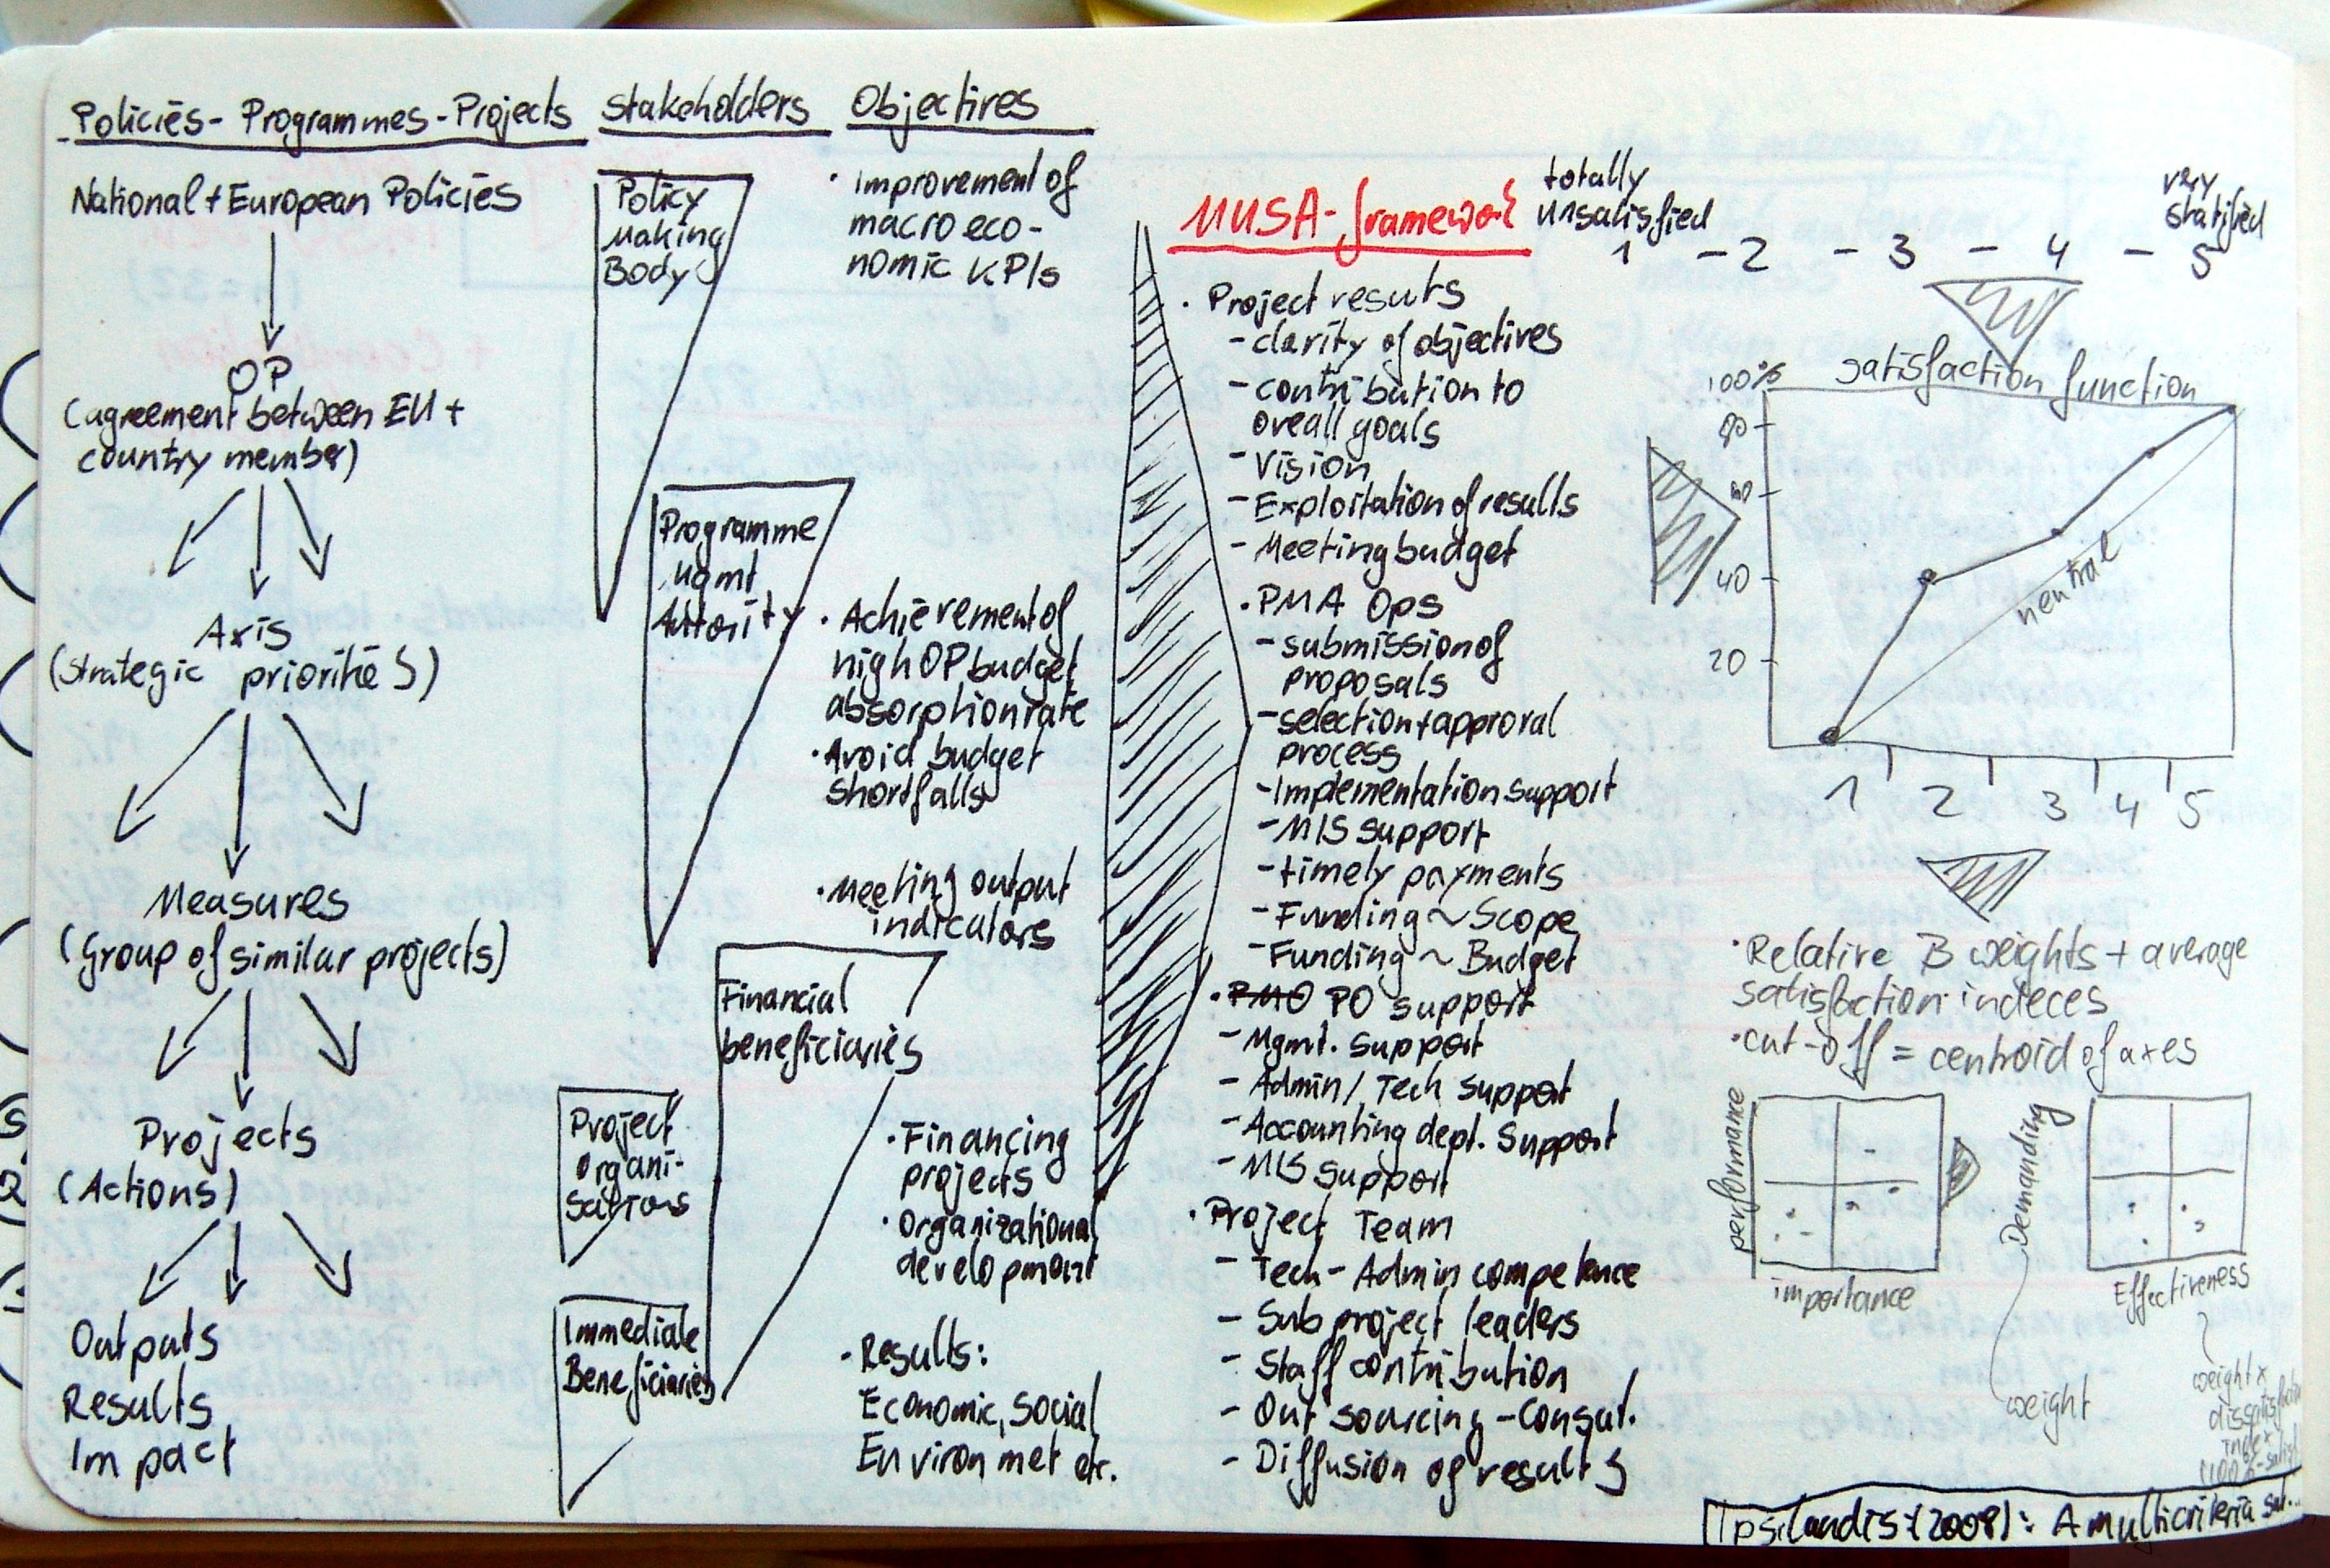
Anyway, Ipsilandis et al. design a tool to measure project/programme satisfaction for European Union programmes. First of all they give a short overview (for all the non-knowing) into the chain of actions at the EU. On top of that chain sit the national/european policies, which become operational programmes (by agreement between the EU and national bodies). Programmes consists of several main lines of actions called axis, which are also understood as strategic priorities. The axis are further subdevided into measures, which are groups of similar projects or sub-programmes. The measures itself contain the single projects, where the real actions take place and outputs, results, and impact is achieved. [I always thought that just having a single program management body sitting on top of projects can lead to questionable overhead.]

Ipsilandis et al. further identify the main stakeholders for each of the chain of policies –> projects. The five stakeholders are – policy making bodies, programme management authority, financial beneficiaries, project organisations, immediate beneficiaries. The authors go on to identify the objectives for each of these stakeholder groups. Then Ipsilandis et al. propose a MUSA framework (multi criteria satisfaction analysis) in which they measure satisfaction (on a five point scale, where 1=totally unsatisfied, and 5=very satisfied)

  • Project results
    • Clarity of objectives
    • Contribution to overall goals
    • Vision
    • Exploitation of results
    • Meeting budget
  • Project management authority operations
    • Submission of proposals
    • Selection and approval process
    • Implementation support
    • MIS support
    • Timely payments
    • Funding ~ Scope
    • Funding ~ Budget
  • Project Office support
    • Management support
    • Admin/tech support
    • Accounting dept. support
    • MIS support
  • Project Team
    • Tech/admin competence
    • Subproject leader
    • Staff contribution
    • Outsourcing/consultants
    • Diffusion of results

The authors then run through a sample report, which contains the typical representations of satisfaction scores, but they have 3 noteworthy ideas – (1) the satisfaction function, (2) performance x importance matrix, and (3) demanding x effectiveness matrix. The satisfaction function is simply the distribution function of satisfaction scores.
[I still do not understand why the line between 0% at score 1 and 100% at score 5 should represent neutrality – Such a line would assume uniform distribution of scores, where I think normal distribution is more often the case, which is also acknowledged by the authors, when they try to establish beta-weights via regression analysis, where normality is a pre-requisite for.]

Furthermore Ipsilandis et al. continue to establish the relative beta-weights for each item and calculate the average satisfaction index accordingly (satisfaction is indexed at 0% to 100%). Cutting-off at the centroid on each axis they span a 2×2 matrix for importance (beta-weight) vs. performance (satisfaction index). The authors call these diagrams „Action diagrams“.
[Centroid of the axis is just a cool way of referring to the mean.]

The third set of diagrams, the so called „Improvement diagrams“, are demanding vs. effectiveness matrices. The demanding dimension is defined by the beta-weights once more. The rational behind this thinking is, that a similar improvement leads to higher satisfaction at items with a higher beta-weight. The effectiveness dimension is the weighted dissatisfaction index. Simply put it is beta-weight*(100%-satisfaction index %). Reasoning behind this is to identify the actions with a great marginal contribution to overall satisfaction and only little effort needed.
[I still don’t understand why this diagram is needed, since the same message is conveyed in the ‚action diagrams‘ – anyway, a different way of showing it. Same, same but different.
What I previously tried to fiddle around with are log-transformations, e.g. logit, to model satisfaction indeces and their development in a non-linear fashion, instead of just weighting and normalising them. Such a procedure would put more importance on very low and very high values, following the reasoning, that fixing something completely broken is a big deal, whereas perfecting the almost perfect (think choosing the right lipstick for Scarlett Johannson) is not such a wise way to spend your time and money (fans of Ms. Johannson might disagree).]
Formulation of Financial Valuation Methodologies for NASA’s Human Spaceflight Program (Hawes & Duffey, 2008)

Dienstag, August 12th, 2008

Real Option Modelling of Projects

Hawes, W. Michael; Duffey, Michael R.: Formulation of Financial Valuation Methodologies for NASA’s Human Spaceflight Program; in: Journal of Project Management, Vol. 39 (2008), No. 1, pp. 85-94.

In this article Hawes & Duffey explore real option analysis as a financial management tool to evaluate projects. The basic idea behind that is management can make go/no-go decisions thus eliminating the downside variability of the value of the project. In short you can always kill a project gone bad of course with sinking some costs.
[Some might call again for Occam’s razor and argue that it is sufficient to model this into the cash flow, because for the option price you need a cash flow anyway. But the authors ]

To put the classical Black-Scholes formula to use the authors look for equivalents to the input variables. More specifically they analyse NASA’s space flight program and valuated projects in respect to their go/no-go decision after the conceptual design. The authors used as input variables

  • NPV of project cash flow = Asset-value (S)
  • Actual one-time development costs = Exercise cost of the option (X)
  • Time until go/no-go decision = Expiry time of the option (T)
  • 5% treasury bill rate of return = Risk-free rate of return (R(f))
  • Historical data on initial budget estimate vs. actual development costs = Distribution of underlying (σ²)

Hawes & Duffey then compare the Black-Scholes pricing to the NPV and find that projects with higher volatility and longer time until decisions are higher priced than short-term decisions with less volatility (i.e. history of cost overruns).

I do find the managerial implications quite counter-intuitive. I modelled some Black-Scholes pricing for a real life project I worked on. My project had a NPV of 48 Mio. EUR but only an option price of 17 Mio EUR since the company had a history of cost overruns and a lot of front-loaded costs, in fact 70% of total expenditures would be spend before the go/no-go decision.
That is all very well and I can clearly see how that improves the decision making,
but if I look into the sensitivity analysis the longer the time to decision and the higher the volatility the higher is my option’s price. This is where I do not fully understand the managerial implication. Given that a similar judgement rule to a decision based on NPV comparison, I would favour a project where I decide later and I would favour projects from a department with higher variability in costs, because this gives me a higher degree of flexibility and higher variability can yield a higher gain. Surely not!?!?

The impact of project portfolio management on information technology projects (De Reyck et al., 2005)

Dienstag, Juli 15th, 2008

De Reyck, Bert; Grushka-Cockayne, Yael; Lockett, Martin; Calderini, Sergio Ricardo; Moura, Marcio; Sloper, Andrew: The impact of project portfolio management on information technology projects; in: International Journal of Project Management, Vol. 23 (2005), No. 7, pp. 524-537.
http://dx.doi.org/10.1016/j.ijproman.2005.02.003

In their article de Reyck et al. argue that project portfolio management (PPM) is essential to create value with IT project. The research focus is the management of resources and risk. Moreover most articles are from vendors of the software, promoting the value of the PPM process, a claim not based on any empirical evidence.

Based on findings from a survey about PPM adoption, de Reyck et al. introduce a three-stage classification scheme of PPM adoption. Furthermore they show that a strong correlation exist between increasing adoption of PPM processes and a reduction in project related problems, and between PPM adoption and project performance.

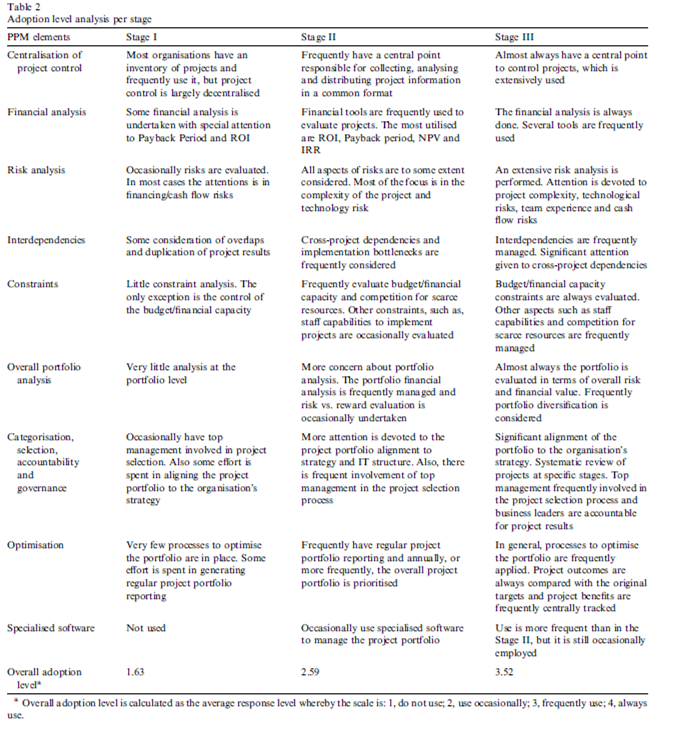
Their maturity model shows how the elements of PPM (centralisation of project control, financial analysis, risk analysis, interdependencies, constraints, overall portfolio analysis, categorisation/selection/accountability and governance, optimisation, and specialised software) are adopted in each of their 3 stages:

PPM Maturity Model (de Reyck et al. 2005, p. 530)

from: De Reyck et al. (2005), p. 530

In my opinion the question remains if organisations in stage 3 follow a controlling agenda more than they actually empower their project managers.