Archive for the ‘Scheduling’ Category

Human Effort Dynamics and Schedule Risk Analysis (Barseghyan, 2009)

Dienstag, April 21st, 2009

DSC02127

Barseghyan, Pavel: Human Effort Dynamics and Schedule Risk Analysis; in:  PM World Today, Vol. 11(2009), No. 3.
http://www.pmforum.org/library/papers/2009/PDFs/mar/Human-Effort-Dynamics-and-Schedule-Risk-Analysis.pdf

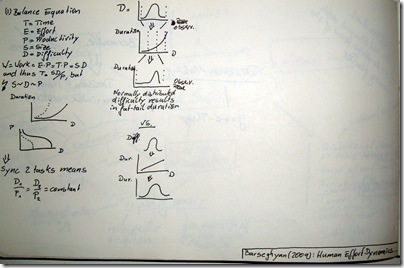
Barseghyan researched extensively the human dynamics within project work.  He has formulated a system of intricate mathematics quite similar to Boyle’s law and the other gas laws.  He establishes a simple set of formulas to schedule the work of software developers.

T = Time, E = Effort, P = Productivity, S = Size, and D = Difficulty
Then W = E * P = T * P = S * D, and thus T = S*D/P

But and now it gets tricky S~D~P are correlated!

The author has collected enough data to show the typical curves between Difficulty –> Duration and Difficulty –> Productivity.  To schedule and synchronise two tasks the D/P ratio has to be constant between these two tasks.


Barseghyan then continues to explore the details between Difficulty and Duration.  He argues that the common notion of bell-shaped distributions is flawed because of the non linear relationship between Difficulty –> Duration  [note that his curves have a segment of linearity followed by some exponential part.  If the Difficulty bell curve is transformed into the Diffculty–>Duration probability function using that non-linear transformation formula it looses is normality and results in a fat-tail distribution.  Therefore Barseghyan argues, the notion of using bell-shaped curves in planning is wrong.  
Protecting Software Development Projects against Underestimation (Miranda & Abran, 2008)

Montag, November 3rd, 2008

Protecting Software Development Projects against Underestimation (Miranda & Abran, 2008)

Miranda, Eduardo; Abran, Alain: Protecting Software Development Projects Against Underestimation; in: Project Management Journal, Vol. 39, No. 3, 75–85.
DOI: 10.1002/pmj.20067

In this article Miranda & Abran argue „that project contingencies should be based on the amount it will take to recover from the underestimation, and not on the amount that would have been required had the project been adequately planned from the beginning, and that these funds should be administered at the portfolio level.“

Thus they propose delay funds instead of contingencies. The amount of that fund depends on the magnitude of recovery needed (u) and the time of recovery (t).  t and u are described using a PERT-like model of triangular probability distribution, based on a best, most-likely, and worst case estimation.

The authors argue that typically in a software development three effects occur that lead to underestimation of contingencies. These three effects are (1) MAIMS behaviour, (2) use of contingencies, (3) delay.
MAIMS stands for ‚money allocated is money spent‘ – which means that cost overruns usually can not be offset by cost under-runs somewhere else in the project. The second effect is that contingency is mostly used to add resources to the project in order to keep the schedule. Thus contingencies are not used to correct underestimations of the project, i.e. most times the plan remains unchanged until all hope is lost. The third effect is that delay is an important cost driver, but delay is only acknowledged as late as somehow possible. This is mostly due to the facts of wishful thinking and inaction inertia on the project management side.

Tom DeMarco proposed a simple square root formula to express that staff added to a late project makes it even later. In this paper Miranda & Abran break this idea down into several categories to better estimate these effects.

In their model the project runs through three phases after delay occurred:

  1. Time between the actual occurence of the delay and when the delay is decided-upon
  2. Additional resources are being ramped-up
  3. Additional resources are fully productive

During this time the whole contingency needed can be broken down into five categories:

  1. Budgeted effort, which would occur anyway with delay or not = FTE * Recovery time as orginally planned
  2. Overtime effort, which is the overtime worked of the original staff after the delay is decided-upon
  3. Additional effort by additional staff, with a ramp-up phase
  4. Overtime contibuted by the additonal staff
  5. Process losses du to ramp-up, coaching, communication by orginal staff to the addtional staff

Their model also includes fatigue effects which reduce the overtime worked on the project, with the duration of that overtime-is-needed-period. Finally the authors give a numerical example.

Factors influencing the selection of delay analysis methodologies (Braimah & Ndekugri, 2008)

Montag, September 22nd, 2008

 Delay analysis

Braimah, Nuhu; Ndekugri, Issaka: Factors influencing the selection of delay analysis methodologies; in: International Journal of Project Management, in press (2008).

Delay analysis. What a great tool. Whoever fought a claim with a vendor, might appreciate this. Braimah & Ndekugri analysed the factors influencing the decision which delay-analysis to use. Their study was done in the construction industry where delay analysis is a common tool in claims handling. [On the other side, I have not seen a delay analysis done for a fight with a vendor on an IT project. There is so many things we can learn.]

The authors identify 5 different types of delay analysis.
(1) Time-impact analysis – the critical event technique – modelling the critical path before and after each event
(2) As-planned vs. as-built comparison – the shortcut – compare these two projections, don’t change the critical path, might skew the impact of the event if work wasn’t going to plan previously
(3) Impacted vs. as-built comparison  – the bottom-line – analyse the new date of completion, but no changes to critical path
(4) Collapsed vs. as-built comparison – the cumbersome – first an as-built critical path is calculated retrospectively (this is tricky and cumbersome), secondly all delays are set to zero = collapsing. The difference between these two completion dates is the total delay.
(5) Window analysis – the best of all worlds – the critical path is split into timeframes and only partial as-built critical paths are modelled. The total delay is the total delay of windows impacted by the event in question. Good way to break-down complexity and dynamics into manageable chunks.

In the second part [which I found less interessting, but on the other hand I never touched this interesting analytical subject of delay-analysis before] the authors explore the factors influencing the delay analysis used. The factors found are

  • Project characteristics
  • Requirements of the contract
  • Characteristics of the baseline programme
  • Cost proportionality
  • Timing of analysis
  • Record availability