Archive for April, 2009

Standish Chaos Report 2009

Dienstag, April 28th, 2009

Standish 2009

The Standish Group just published their new findings from the 2009 CHAOS report on how well projects are doing.  This years figures show that 32% of all projects are successful, 44% challenged, and 24% fail.  As the website says startling results especially that they still do not hold up to scientific standards and replications of this survey (e.g. Sauer, Gemino & Reich) find exactly the opposite picture.

Integrating the change program with the parent organization (Lehtonen & Martinsuo, 2009)

Dienstag, April 28th, 2009

DSC02128

Lehtonen, Päivi; Martinsuo, Miia: Integrating the change program with the parent organization; in: International Journal of Project Management, Vol. 27 (2009), No. 2, pp. 154-165.
http://dx.doi.org/10.1016/j.ijproman.2008.09.002


Lehtonen & Martinsuo analyse the boundary spanning activities of change programmes.  They find five different types of organisational integration – internal integration 1a) in the programme, 1b) in the organisation; external integration 2a) in the organisation, 2b) in the programme, and 3) between programme and parent organisation.

Furthermore they identify mechanisms of integration on these various levels.  These mechanisms are

  Mechanism of integration
Structure & Control Steering groups, responsibility of line managers
Goal & content link Programme is part of larger strategic change initiative
People links Cross-functional core team, part-time team members who stay in local departments
Scheduling & Planning links Planning, project management, budgeting, reporting
Isolation Abandon standard corporate steering group, split between HQ and branch roll-out


Among most common are four types of boundary spanning activities – (1) Information Scout, (2) Ambassador, (3) Boundary Shaping, and (4) Isolation.  Firstly, information scouting is done via workshops, interviews, questionnaire, data requests &c.  Secondly, the project ambassador presents the programme in internal forums, focuses on quick wins and show cases them, publishes about the project in HR magazines &c.  Thirdly, the boundary shaping is done by negotiations of scope and resources, and by defining responsibilities.  Fourthly, isolation typically takes place through withholding information, establishing a separate work/team/programme culture, planning inside; basically by gate keeping and blocking.   

Web 2.0 what is it really about

Montag, April 27th, 2009

DSC02124

This is beautiful, and done by some very clever colleagues of mine.  It is thought provoking and you since a lot of people out there run wild for ‚2.0‘ postfixes to whatever they do; this is the ultimate checklist.  It is in essence what Jeff Jarvis wrote in What would Google do? although only few people like the book and I have not even started reading it.

Orthodoxies New freedoms Example
Role of companies and customers are distinct Customers are integral part of the operations customers as designers, customers as clerks
Companies size gives them an edge over individuals Access to better information and cheaper communications reduce advantage of size Newspapers vs. blogs
Competitive advantage derives from control over unique asset Orchestration trumps ownership Linux, wikipedia
Hierarchies are best organising framework Reduced cost of information and communication enable adaptive, loosely coupled organisations Open Source
Business processes are batch-driven Continuous information flow drives operations to resemble continuous processes Services
The best people trust their gut Data ubiquity reduces subjectivity Google
You pay for what you get Consumers get valuable services for free ("Free is a better price than cheap") Music, Google Aps
Fat tails, short tails Long tails can be served and offer attractive margins amazon

Failure at the Speed of Light (Hickerson, 2006)

Samstag, April 25th, 2009

[Hot stuff! Not because it is fresh or hot of the press, no but surprisingly "Failed Projects" is the most read category on this blog this year with more than 700 readers, runner-up is "Critical Success Factors" and it is catching up quickly. ]

DSC02123

Hickerson, Thomas B.: Failure at the Speed of Light – Project Escalation and De-escalation in the Software Industry, Master of Arts in Law and Diplomacy Thesis, Tufts University, Medford, Massachusetts, 2006.
http://fletcher.tufts.edu/research/2006/Hickerson.pdf


Hickerson analyses three case studies – (1) California’s Department of Social Securities implementation of the California Automated Child Support System (CACSS), (2) Denver International Airport, and (3) FBI’s Virtual Case File.

Firstly, CACSS was planned and started in 1992, the tender went to Lockheed Martin for $75m with a go-live in December 1995.  The whole project was cancelled in 1997 after direct expenses of $100m were incurred.  A new version of the system started development in 2000 and finally went live in June 2008 (see this news snippet) and it is online here.

Second case is the Denver International Baggage Handling system.  This case is infamous to the extend that it made it on wikipedia, the full GAO report can be found here.  In short: BAE won the tender for $193m.  The system development had so many problems that in order to open the airport an alternative manual handling system was installed, which came at a price ticket of only $51m; at the time of opening the airport (Feb 1995, 2 years behind schedule anyway) the delays caused by the baggage handling system were estimated to be $360m.  Before United axed the system it cost about $1m per month in maintenance.

Third case is the FBI’s Virtual Case File.  The project started in 2001, quickly reached the typical 90% complete.  After 4 years the solution was replaced by a commercial off the shelf software and another 3 months later the project was cancelled altogether after $607m were spent.


Drawing from Social Justification Theory, Agency Theory, Approach Avoidance Theory Hickerson argues that ‚Internal inadequacies in dealing with external threats‘ was the main reason for the failures.  In case of DIA some project factors contributed to the failure such as the investment character of the project, long-term pay-offs, large size of the pay-offs, resources seen as plentiful, setbacks seen as secondary.

Apart from project factors psychological factors contributed to the failure of these cases, e.g., personal responsibility, ego importance, prior success and reinforcement, irreversibility of prior expenditures.  Thirdly social factors were responsible, such as the responsibility for failure, norms for consistency, hero effects, public identification with the course of action, and job insecurity.  Fourthly, structural factors played a role, e.g., political support, institutionalisation, and bureaucracy.


What were the tipping points that tipped the projects into escalation?

  • Change in top management support
  • External shocks to the organisation
  • Change in project champion
  • Organisational tolerance for failure
  • Presence of publicly stated resources
  • Alternate use of funds
  • Awareness of problems
  • Visibility of costs
  • Clarity of failure & success criteria
  • Organisational procedures of decision-making
  • Regular evaluation of projects
  • Separation of responsibility for approving and evaluation projects

What needs to be done to prevent escalation?

  1. Strict timeline
  2. Clear acceptance criteria
  3. Daily meetings between CIO and Managers
  4. Adherence to baseline requirements

The influence of checklists and roles on software practitioner risk perception and decision-making (Keil et al., 2008)

Freitag, April 24th, 2009

DSC02122

Keil, Mark; Li, Lei; Mathiassen, Lars;  Zheng, Guangzhi: The influence of checklists and roles on software practitioner risk perception and decision-making; in: Journal of Systems and Software, Vol. 81 (2008), No. 6, pp. 908-919.
http://dx.doi.org/10.1016/j.jss.2007.07.035 

In this paper the authors present the results of 128 role plays they conducted with software practitioners.  These role plays analysed the influence of checklists on the risk perception and decision-making.  The authors also controlled for the role of the participant, whether he/she was an insider = project manager or an outsider = consultant.  They found the role having no effect on the risks identified.

Keil et al. created a risk checklist based on the software risk model which was first conceptualised by Wallace et al. This model distinguishes 6 different risks – (1) Team, (2) Organisational environment, (3) Requirements, (4) Planning and control, (5) User, (6) Complexity. 
In their role plays the authors found that checklists have a significant influence on the number of risks identified. However the number of risks does not influence the decision-making.  Decision-making is influenced by the fact whether the participants have identified some key risks or not.  Therefore the risk checklists can influence the salience of the risks, i.e., whether they are perceived or not, but it does not influence the decision-making.

Managing the development of large software systems (Royce, 1970)

Donnerstag, April 23rd, 2009

DSC02121

Royce, W. Winston: Managing the development of large software systems; in: Proceedings of IEEE Wescon (1970), pp. 382-338.
http://leadinganswers.typepad.com/leading_answers/files/original_waterfall_paper_winston_royce.pdf

It’s never to late to start reading a classic.  This is one for sure.  The original paper which proposes the waterfall software development model.  This is now extremely common place – but and that is what stroke me odd as well, the model shows a huge number of feedback loops which typically are omitted.

The steps of the original waterfall are as follows

  1. System Requirements
  2. Software Requirements
  3. Preliminary Program Design which includes the preliminary software review
  4. Analysis
  5. Program Design which includes several critical software reviews
  6. Coding
  7. Testing which includes the final software review
  8. Operations

Among the interesting loops in this model is the big feedback from testing into program design and from program design into software requirements.  By no means can is this model what we commonly assume to be a waterfall process – there are no frozen requirements, no clear cut steps without any looking back.  This is much more RUP or AGILE or whatever you want to call it than the waterfall model I have in my head.

The resource allocation syndrome (Engwall & Jerbant, 2003)

Mittwoch, April 22nd, 2009

DSC02120

Engwall, Mats; Jerbant, Anna: The resource allocation syndrome – the prime challenge of multi-project management?; in: International Journal of Project Management, Vol. 21 (2003), No. 6, pp. 403-409.
http://dx.doi.org/10.1016/S0263-7863(02)00113-8

Engwall & Jerbant analyse the nature of organisations, whose operations are mostly carried out as simultaneous or successive projects. By studying a couple of qualitative cases the authors try to answer why the resource allocation syndrome is the number one issue for multi-project management and which underlying mechanisms are behind this phenomenon.

The resource allocation syndrome is at the heart of operational problems in multi-project management, it’s called syndrome because multi-project management is mainly obsessed with front-end allocation of resources.  This shows in the main characteristics: projects have interdependencies and typically lack resources; management is concerned with priority setting and resources re-allocation; competition arises between the projects; management focuses on short term problem solving.

The root causes for these syndromes can be found on both the demand and the supply side.  On the demand side the two root causes identified are the effect of failing projects on the schedule, the authors observed that project delay causes after-the-fact prioritisation and thus makes management re-active and rather unhelpful; and secondly over commitment cripples the multi-project-management.

On the supply side the problems are caused by management accounting systems, in this case the inability to properly record all resources and projects; and effect of opportunistic management behaviour, especially grabbing and booking good people before they are needed just to have them on the project.

Human Effort Dynamics and Schedule Risk Analysis (Barseghyan, 2009)

Dienstag, April 21st, 2009

DSC02127

Barseghyan, Pavel: Human Effort Dynamics and Schedule Risk Analysis; in:  PM World Today, Vol. 11(2009), No. 3.
http://www.pmforum.org/library/papers/2009/PDFs/mar/Human-Effort-Dynamics-and-Schedule-Risk-Analysis.pdf

Barseghyan researched extensively the human dynamics within project work.  He has formulated a system of intricate mathematics quite similar to Boyle’s law and the other gas laws.  He establishes a simple set of formulas to schedule the work of software developers.

T = Time, E = Effort, P = Productivity, S = Size, and D = Difficulty
Then W = E * P = T * P = S * D, and thus T = S*D/P

But and now it gets tricky S~D~P are correlated!

The author has collected enough data to show the typical curves between Difficulty –> Duration and Difficulty –> Productivity.  To schedule and synchronise two tasks the D/P ratio has to be constant between these two tasks.


Barseghyan then continues to explore the details between Difficulty and Duration.  He argues that the common notion of bell-shaped distributions is flawed because of the non linear relationship between Difficulty –> Duration  [note that his curves have a segment of linearity followed by some exponential part.  If the Difficulty bell curve is transformed into the Diffculty–>Duration probability function using that non-linear transformation formula it looses is normality and results in a fat-tail distribution.  Therefore Barseghyan argues, the notion of using bell-shaped curves in planning is wrong.  

Please Vote – Projects: Living People or Black Swans?

Sonntag, April 19th, 2009

Everyone, please vote which approach you think is right.  Let me outline that for you.

Yesterday I read the Black Swan by Nassim Nicholas Taleb.  It is a great book.  In short it is about our (as in the human mankind) inability to predict rare events.  He details a lot of psychological reasons, e.g., tunneling, narrative fallacy; for us not being able to predict these Black Swans and he also shows what we can do about it.  Great book – highly recommended.  Anyway, yesterday I was reading page 159 (for the ones who have a copy handy); and there he makes the hypothetical argument that we think about project deadlines as if they were probabilistically the same as our life expectancy – partly because that’s how we evolved.  So what do you think – is that really true?  But let’s understand that distinction in detail first.

1) Living People

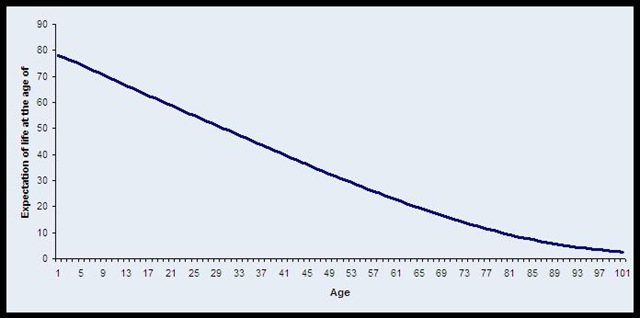
Life expectancy figures are the very centre of an actuary’s daily life, at least the ones who insure health and life &c.  When you meet one at a party you’ll understand how exciting this topic can be.  What life expectancy figures do is to look at the dying age distribution with in a population; ages are ordered neatly by age and then the actuaries compute the probability of dying before your next birthday.  That also gives you then an expected age which is the year by which 50% of your fellow birthday-boys and girls will be dead.  The expected age is per definition an average. 

If you look up the tables and they chart quite nicely as well (cf. the graph below) you’ll see that in 2004 in the US the expected age for a newborn is 77.8 years.  Some of them die (a saddening 680 that is) before they reach their first birthday. So if you made it there then you can expect to live for another 77.4 years which allows you to expect your death shortly after your 78th birthday.  When you turn 30 then you can expect to live for 49.3 more years (or 79.3 in total), when you reach 50 you could expect another 30.9 years (80.9 in total) and so on. 

cdc

Source: CDC Life table for the total population:  United States, 2004

What if project delays would be like a living population?

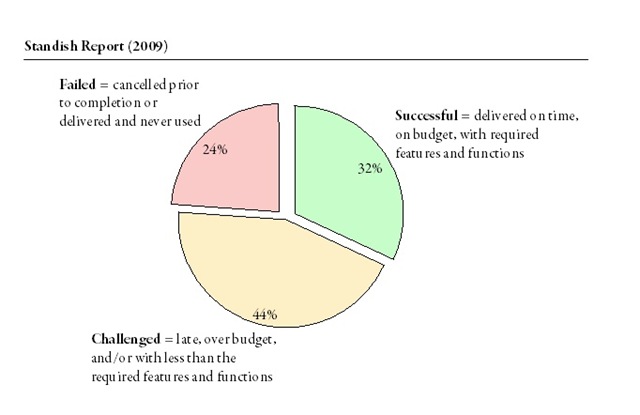
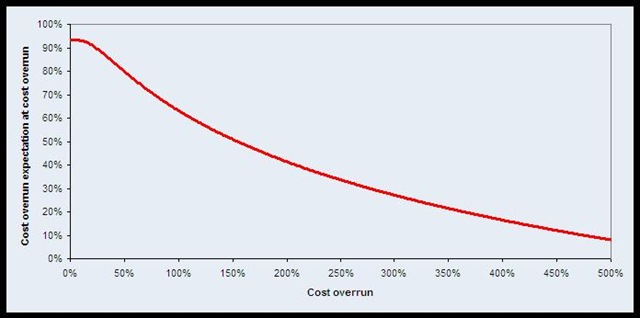
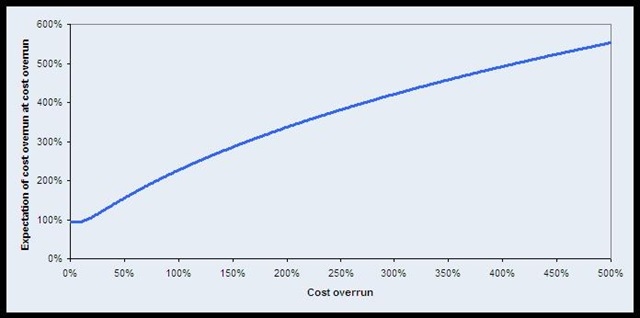
In the book Taleb argues that we typically think of project delays having the same probabilistic properties as life expectancy curves.  That is on average all projects are delayed by 3 weeks, and when a project is delayed by 2 weeks it will be delayed by an additional 1.5 weeks and so on.  Since I don’t have nice raw data and my own data pool is not yet big enough for nice analysis like that, once again I plundered the cost overrun figures from the Standish Group report.  When computed and charted it looks like this:

projects

What does it say?  Well, when the project is still immaculate with 0% cost overrun, you would expect it to overrun its budget by +98%.  If your project already shows a budget overrun of 100% it will need another +63% (so in total it will be +163%), if it has overrun its budget by +300% you would put aside another +27% (totaling it at +327%) and so on.

2) The Black Swan

So what are these Black Swans all about?  An excerpt from the McKinsey Quarterly (No. 1, 2009) where the author summarises his central thesis beautifully (cf. the full article here):

Before Europeans discovered Australia, we had no reason to believe that swans could be any other color but white. But they discovered Australia, saw black swans, and revised their beliefs. My idea in The Black Swan is to make people think of the unknown and of the potency of the unknown, particularly a certain class of events that you can’t imagine but can cost you a lot: rare but high-impact events.

So my black swan doesn’t have feathers. My black swan is an event with three properties. Number one, its probability is low, based on past knowledge. Two, although its probability is low, when it happens it has a massive impact. And three, people don’t see it coming before the fact, but after the fact, everybody saw it coming. So it’s prospectively unpredictable but retrospectively predictable.

Now that we’re in this financial crisis, for example, everybody saw it coming. But did they own bank stocks? Yes, they did. In other words, they say that they saw it coming because they had some thoughts in the shower about this possibility—not because they truly took measures to protect themselves from it.

Now, a black swan can be a negative event like a banking crisis. It also can be positive: inventing new technology, making new discoveries, meeting your mate, writing a best seller, or developing a cure for cancer, baldness, or bad breath. In The Black Swan, I say that in the historical and socioeconomic domain, black swans are everything. If you ignore black swans, you’ve got nothing. And I showed that the computer, the Internet, and the laser—three recent technological black swans—came out of nowhere. We didn’t know what they were, and when we had them right before our eyes we didn’t know what to do with them. The Internet was not built as something to help people communicate in chat rooms; it was a military application and it evolved.

So these things have a life of their own. You cannot predict a black swan. We also have some psychological blindness to black swans. We don’t understand them, because, genetically, we did not evolve in an environment where there were a lot of black swans. It’s not part of our intuition.

In the book The Black Swan he argues on page 159 that when we make predictions of project schedules we tend to make them without looking for external events.  In his example of a publishing deadline – it may be the sick grandmother, sudden financial troubles which force the author to take on a night shift job, or a terrorist attack that troubles your mind for some months.  These things happen, yet we never acknowledge them in the first place.  So he argues a project that is late by 3 months should be expected to be late by another 5 weeks, if it then is not ready after 5 months you would expect another 6 weeks, at a year delay you would rather expect it to be delayed another 5 years than expecting it to be ready within the next 2 weeks – he argues that in reality the marginal expected project delay increases and does not decrease.

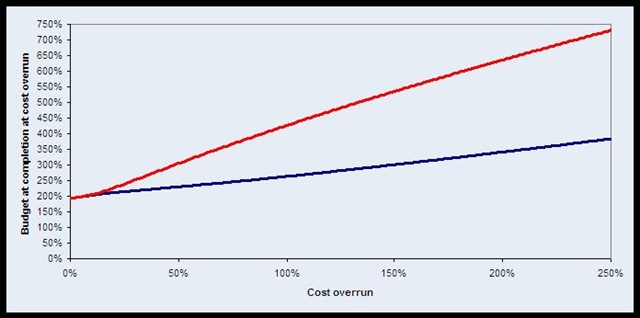
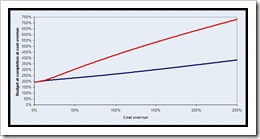
So, if we go ahead and compute the same Standish Figures with these probabilistic assumptions then we get the following picture:

projects2

So what do these numbers tell us?  Well, if the project is in budget, we better expect +98% budget overrun.  If it however is +100% over budget you better expect +226% more (that is a +326% total budget overrun); and when you get there at +326% you would expect +441% additional costs adding up to a whooping +767%.  You get the idea.

So if we chart that as "expectation of total budget at completion at cost overrun of"-diagram the curves look like that:

bac


3) Your turn – the vote

What do you think is true for Projects – do cost overruns of projects show probabilistic features of living people or are they Black Swans?

Online Surveys & Market Research

Thanks.