Author Archive

Leadership for future construction industry – Agenda for authentic leadership (Toor & Ofori, 2008)

Montag, September 22nd, 2008

 Leadership for future construction industry

Toor, Shamas-ur-Rehman; Ofori, George: Leadership for future construction industry – Agenda for authentic leadership; in: International Journal of Project Management, in press (2008).

Ever since Bill George popularized the meme „authentic leadership“ more and more articles pop up investigating this concept. In George’s words ‚authentic leadership‘ is simply just being yourself. Leadership is authenticity, not style! This includes building your own leadership style, adapting it to different situations, but also realising which weaknesses you have. Enough said – a summary can be found here.

Toor & Ofori look into the authentic leadership concept and root the ’new‘ way of leading on three antecedents – (1) image/style of the traditional project manager, (2) postitive mediation of leadership antecedents, and (3) positive environmental context. Thus allowing the authentic leader to develop, where leaders achieve awareness, can process unbiased, showthe distinct/authentic behaviour, and develop a relational orientation.
In Toor & Ofori’s article such a developmental process leads to an authentic leader who is characterised by

  • Confidence
  • Hopefulness
  • Optimism
  • Resilience
  • Transparency
  • Moral/Ethics
  • Future orientation
  • Associate building

Factors influencing the selection of delay analysis methodologies (Braimah & Ndekugri, 2008)

Montag, September 22nd, 2008

 Delay analysis

Braimah, Nuhu; Ndekugri, Issaka: Factors influencing the selection of delay analysis methodologies; in: International Journal of Project Management, in press (2008).

Delay analysis. What a great tool. Whoever fought a claim with a vendor, might appreciate this. Braimah & Ndekugri analysed the factors influencing the decision which delay-analysis to use. Their study was done in the construction industry where delay analysis is a common tool in claims handling. [On the other side, I have not seen a delay analysis done for a fight with a vendor on an IT project. There is so many things we can learn.]

The authors identify 5 different types of delay analysis.
(1) Time-impact analysis – the critical event technique – modelling the critical path before and after each event
(2) As-planned vs. as-built comparison – the shortcut – compare these two projections, don’t change the critical path, might skew the impact of the event if work wasn’t going to plan previously
(3) Impacted vs. as-built comparison  – the bottom-line – analyse the new date of completion, but no changes to critical path
(4) Collapsed vs. as-built comparison – the cumbersome – first an as-built critical path is calculated retrospectively (this is tricky and cumbersome), secondly all delays are set to zero = collapsing. The difference between these two completion dates is the total delay.
(5) Window analysis – the best of all worlds – the critical path is split into timeframes and only partial as-built critical paths are modelled. The total delay is the total delay of windows impacted by the event in question. Good way to break-down complexity and dynamics into manageable chunks.

In the second part [which I found less interessting, but on the other hand I never touched this interesting analytical subject of delay-analysis before] the authors explore the factors influencing the delay analysis used. The factors found are

  • Project characteristics
  • Requirements of the contract
  • Characteristics of the baseline programme
  • Cost proportionality
  • Timing of analysis
  • Record availability

A multicriteria satisfaction analysis approach in the assessment of operational programmes (Ipsilandis et al., 2008)

Montag, September 22nd, 2008

A multicriteria satisfaction analysis approach in the assessment of operational programmes (Ipsilandis et al., 2008)

Ipsilandis, Pandelis G.; Samaras, George; Mplanas, Nikolaos: A multicriteria satisfaction analysis approach in the assessment of operational programmes; in: International Journal of Project Management, Vol. 26 (2008), No. 6, pp. 601-611.
http://dx.doi.org/10.1016/j.ijproman.2007.09.003

Satisfaction measurement was one of my big things for a long time, when I was still working in market research. I still believe in the managerial power of satisfaction measurements, although you might not want to do it every 8 weeks rolling. Well, that’s another story and one of these projects where a lot of data is gathered for no specific decision-making purpose and therefore the data only sees limited use.

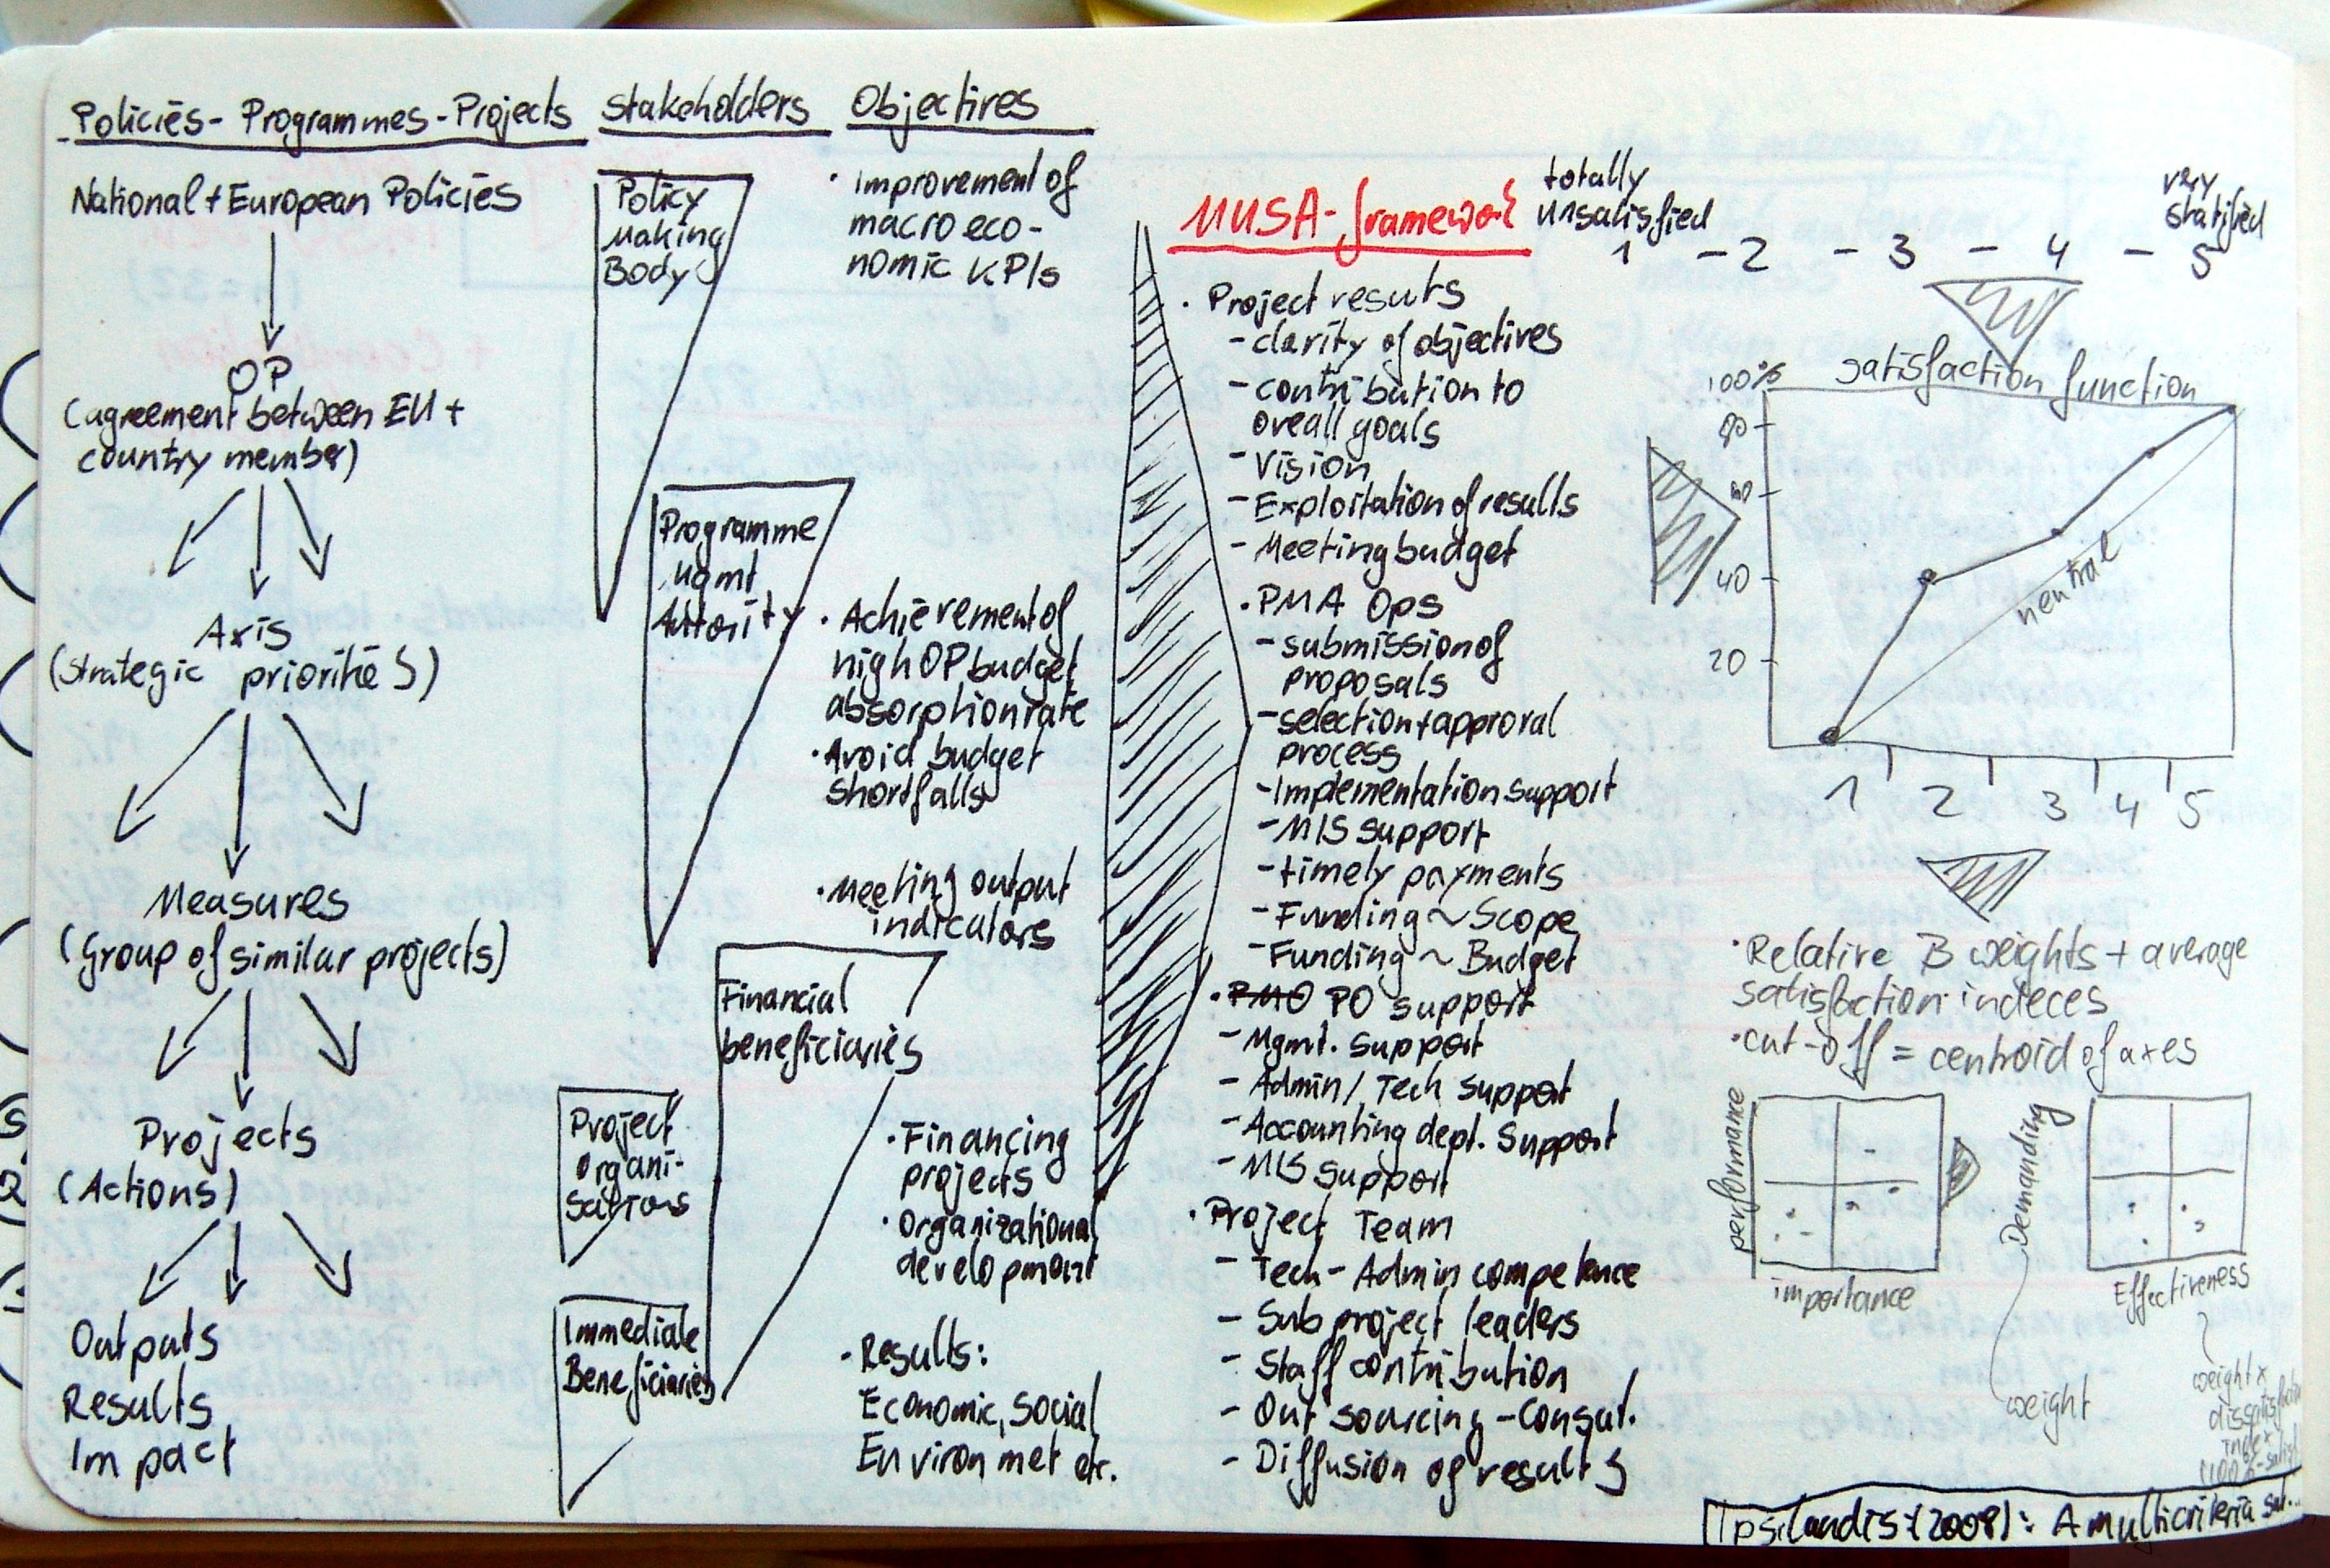
Anyway, Ipsilandis et al. design a tool to measure project/programme satisfaction for European Union programmes. First of all they give a short overview (for all the non-knowing) into the chain of actions at the EU. On top of that chain sit the national/european policies, which become operational programmes (by agreement between the EU and national bodies). Programmes consists of several main lines of actions called axis, which are also understood as strategic priorities. The axis are further subdevided into measures, which are groups of similar projects or sub-programmes. The measures itself contain the single projects, where the real actions take place and outputs, results, and impact is achieved. [I always thought that just having a single program management body sitting on top of projects can lead to questionable overhead.]

Ipsilandis et al. further identify the main stakeholders for each of the chain of policies –> projects. The five stakeholders are – policy making bodies, programme management authority, financial beneficiaries, project organisations, immediate beneficiaries. The authors go on to identify the objectives for each of these stakeholder groups. Then Ipsilandis et al. propose a MUSA framework (multi criteria satisfaction analysis) in which they measure satisfaction (on a five point scale, where 1=totally unsatisfied, and 5=very satisfied)

  • Project results
    • Clarity of objectives
    • Contribution to overall goals
    • Vision
    • Exploitation of results
    • Meeting budget
  • Project management authority operations
    • Submission of proposals
    • Selection and approval process
    • Implementation support
    • MIS support
    • Timely payments
    • Funding ~ Scope
    • Funding ~ Budget
  • Project Office support
    • Management support
    • Admin/tech support
    • Accounting dept. support
    • MIS support
  • Project Team
    • Tech/admin competence
    • Subproject leader
    • Staff contribution
    • Outsourcing/consultants
    • Diffusion of results

The authors then run through a sample report, which contains the typical representations of satisfaction scores, but they have 3 noteworthy ideas – (1) the satisfaction function, (2) performance x importance matrix, and (3) demanding x effectiveness matrix. The satisfaction function is simply the distribution function of satisfaction scores.
[I still do not understand why the line between 0% at score 1 and 100% at score 5 should represent neutrality – Such a line would assume uniform distribution of scores, where I think normal distribution is more often the case, which is also acknowledged by the authors, when they try to establish beta-weights via regression analysis, where normality is a pre-requisite for.]

Furthermore Ipsilandis et al. continue to establish the relative beta-weights for each item and calculate the average satisfaction index accordingly (satisfaction is indexed at 0% to 100%). Cutting-off at the centroid on each axis they span a 2×2 matrix for importance (beta-weight) vs. performance (satisfaction index). The authors call these diagrams „Action diagrams“.
[Centroid of the axis is just a cool way of referring to the mean.]

The third set of diagrams, the so called „Improvement diagrams“, are demanding vs. effectiveness matrices. The demanding dimension is defined by the beta-weights once more. The rational behind this thinking is, that a similar improvement leads to higher satisfaction at items with a higher beta-weight. The effectiveness dimension is the weighted dissatisfaction index. Simply put it is beta-weight*(100%-satisfaction index %). Reasoning behind this is to identify the actions with a great marginal contribution to overall satisfaction and only little effort needed.
[I still don’t understand why this diagram is needed, since the same message is conveyed in the ‚action diagrams‘ – anyway, a different way of showing it. Same, same but different.
What I previously tried to fiddle around with are log-transformations, e.g. logit, to model satisfaction indeces and their development in a non-linear fashion, instead of just weighting and normalising them. Such a procedure would put more importance on very low and very high values, following the reasoning, that fixing something completely broken is a big deal, whereas perfecting the almost perfect (think choosing the right lipstick for Scarlett Johannson) is not such a wise way to spend your time and money (fans of Ms. Johannson might disagree).]

The mechanisms of project management of software development (McBride, 2008)

Montag, September 22nd, 2008

The mechanisms of project management of software development

McBride, Tom: The mechanisms of project management of software development; in: Journal of Systems and Software, Article in Press.
http://dx.doi.org/10.1016/j.jss.2008.06.015

McBride covers two aspects of tools and techniques for the management of software developments. Firstly the monitoring, secondly the control and thirdly the coordination mechanisms used in software development.

The author distinguishes four categories of monitoring tools: automatic, formal, ad hoc, and informal. The most common tools used are schedule tracking, team meeting, status report, management reviews, drill downs, conversations with the team and the customers.

The control mechanisms are categorised by their organisational form of control as either output, behaviour, input, or clan control. The most often used control mechanisms are Budget/schedule/functionality control, formal processes, project plan, team co-location, and informal communities.

Lastly the Coordination mechanisms are grouped by which way the try to coordinate the teams: standards, plans, formal and informal coordination mechanisms. The most common are specifications, schedule, test plans, team meetings, ad hoc meetings, co-location, and personal conversations.

Why New Business Development Projects Fail (Burgers et al. 2008) and Interdependencies in Complex Project Ecologies (Newell et al. 2008)

Donnerstag, September 18th, 2008

 hy New Business Development Projects Fail

Burgers, Henri J.; Van Den Bosch, Frans A.J.; Volberda, Henk W.: Why New Business Development Projects Fail – Coping with the Differences of Technological versus Market Knowledge; in: Long Range Planning, Vol 41 (2008), No. 1, pp. 55-73.
http://dx.doi.org/10.1016/j.lrp.2007.10.003

The authors of the first paper  identify five critical success factors for your new business development project (NBD)

  1. Match project autonomy to newness of technology
  2. Align completion criteria
  3. Get an organisational champion, who can overturn autonomy & completion criteria shortfalls
  4. Explore strategic alliances to speed up market knowledge on technlogoy
  5. Align sales force incentives to NBD

Especially point No. 1 is noteworthy for it’s interesting framework and the transfer of their framework onto other projects, e.g., IT. Burger et al.’s framwork spans two dimensions: market knowledge (existing vs. new) and technology knowledge (existing vs. new). If both knowledge areas are new fields to the organisation (technology and market), the project needs maximum autonomy, it’s goal should be the exploration and the product should stay in project mode until it achieved profitability. Whereas a project were both areas of knowldge pre-exist, the project should not explore, needs little autonomy and the product should be handed over into operations as soon as it hits the shelves.
Newell, Sue; Goussevskaia, Anna; Swan, Jacky; Bresnen, Mike; Obembe, Ademola: Interdependencies in Complex Project Ecologies – The Case of Biomedical Innovation; in: Long Range Planning, Vol. 41 (2008), No. 1, pp. 33-54.
http://dx.doi.org/10.1016/j.lrp.2007.10.005

The second article in this post examines innovation projects from a different angle. Newell et al. draw a typology of projects based on their ecology and integration. They state that challenges associated with managing projects that are distributed across time, space and organizations – a common, though under-researched, feature of innovation in numerous high-technology domains.

Like marriage counselors they argue that in a complex project environment (high degree of interdependencies) a high level of interactivity is most fruitful. The reality check, as it turns out in the analysis, shows however that most project run as black-boxes, no knowledge is transferred between projects, and the level of collaboration is low at least. A case example for a bad marriage. Finally Newell et al. explore the reasons for this, and pay particular attention  to the effects of power dynamics and the sector’s dominant knowledge regime.

Information Systems implementation failure – Insights from PRISM (Pan et al., 2008)

Donnerstag, September 18th, 2008

 Information Systems implementation failure - Insights from prism

Pan, Gary; Hackney, Ray; Panc, Shan L.: Information Systems implementation failure – Insights from prism; in: International Journal of Information Management, Vol. 28 (2008), pp. 259–269.

The authors apply a „antecedents — critical events — outcomes“-framework to analyse the implementation process. Pan et al. postulate a recursive process interaction model which repeats throughout critical events in the project. The Process modell flows circular between Project Organisation-(innovates)-IS-(serves)-Supporters-(support)-Project Organisation and so on.

Furthermore the authors identify critical events (positive and negative) to analyse the system failure of the whole project. Generalizing from the chain of negative events, Pan et al. found that recursive interactions lead to a drift of the project. Subsequently that drift leads to a sequence of decision mistakes which accelerated into project failure.

Evaluating leadership, IT quality, and net benefits in an e-government environment (Prybutok et al., 2008)

Mittwoch, September 17th, 2008

Evaluating leadership, IT quality, and net benefits in an e-government environment (Prybutok et al., 2008)

Prybutok, Victor, R.; Zhang, Xiaoni; Ryana, Sherry D.: Evaluating leadership, IT quality, and net benefits in an e-government environment; in: Information & Management; Vol. 45 (2008), No. 3, pp. 143-152.
http://dx.doi.org/10.1016/j.im.2007.12.004

The authors did something quit unusual in eGovernment research, they went quantitative. Their survey consisted of 178 useful respondents among the public workers of Denton, TX. It generally tried to establish the cause-effect relationships between

  • Leadership Triad
    • Leadership
    • Strategic Planning
    • Customer/Market Focus
  • IT Quality Triad
    • Information Quality
    • System Quality
    • Service Quality
  • Net Benefits

The results support the hypothesis that the MBNQA leadership triad has a positive impact on the IT quality triad. The authors also found that both leadership and IT quality increased the benefits.

Strategic management accounting and sense-making in a multinational company (Tillmann & Goddard, 2008)

Mittwoch, September 17th, 2008

 Strategic management accounting and sense-making in a multinational company

Tillmann, Katja; Goddard, Andrew: Strategic management accounting and sense-making in a multinational company; in: Management Accounting Research, Vol. 19 (2008), No. 1, pp. 80-102.
http://dx.doi.org/10.1016/j.mar.2007.11.002

Tillmann & Goddard analyse in a large German multi-national corporation how strategic management accounting is used and perceived. This is interesting as insofar they explore how managers work and get decisions made. The authors follow an open systems paradigm, which conceptualises the organisation as a set of ambiguous processes, structures, and environments. In such the manager is operating. Furthermore Tillmann & Goddard identify 4 major typically managerial activities (1) Scanning, (2) Sense-Making, (3) Sense-Giving, and (4) Decision-Making.

Sense-Making is of key interest to the authors. Sense-Making can be understood as constructing and re-constructing meaning, or simply as understanding the situation and getting the picture. Understanding is inherently linked to interpretations of real world events. In order to make-sense of events, simplification strategies are employed, such as translating, modelling, synthesis, and conceptualising/frameworking.

Moreover the authors propose a 3 step process model of sense-making.

  • Input – internal context, multiplicity of aspects, and external context which are individually internalised as information sets and ‚a feel for the game‘
  • Sense-Making – structuring & harmonising, compromising & balancing, and bridging & contextualising
  • Output – sense communication and decision-making

Post-project reviews as a key project management competence (Anbari et al., 2008)

Mittwoch, September 17th, 2008

 Post-project reviews as a key project management competence

Anbari, Frank T.; Carayannis, Elias G.; Voetsch, Robert J.: Post-project reviews as a key project management competence; in: Technovation, Vol. 28 (2008), No. 10, pp. 633-643.
http://dx.doi.org/10.1016/j.technovation.2007.12.001

George Santayana was the wise guy who said: „Those who cannot remember the past are condemned to repeat it.“ At university I learned that 2 strategies exist to make an organisation remember it’s past – Internalisation and Codification. While internalisation usually happens anyway and an organisation only needs to keep track on who did which projects in the past, so that he can be interviewed, the codification bit is tricky.

Anbari et al. describe which interest are held by which stakeholder group and how that is going to impact any knowledge management or lack thereof. The authors also outline useful techniques and critical aspects, plus when project reviews are most usefully held during the project lifecycle.

Furthermore, the paper discusses where post-project reviews fit into the project life cycle and project management processes. It assesses how such reviews can assist an organization in improving the manner in which its projects are conceived, planned, implemented, reported, and evaluated.

Finally Anbari et al. outline a 3-fold growth model for organisations
(1) Vicious circle = no real reviews
(2) Functional circle = reviews which no one knows about
(3) Virtuous circle = reviews everybody knows.

Investing Smarter in Public Sector ICT (VAGO (Ed.), 2008)

Mittwoch, September 17th, 2008

 Investing Smarter in Public Sector ICT

Victorian Auditor-General’s Office (VAGO): Investing Smarter in Public Sector ICT, Melbourne 2008.
Download available here: http://download.audit.vic.gov.au/files/ICT_BPG_Intro.pdf

The VAGO has recently published (if I remember correctly it was end of July) a 6 step best practices guide on how to invest into ICT. The best part – it’s written in a clear, non-techy language. Readers don’t have to be the master genius of IT to put this into practice. They break down the ICT project flow into 6 distinct steps, which are
(1) Understand & Explore
(2) Identify & Refine options
(3) Decide to invest
(4) Procure a solution
(5) Manage delivery
(6) Review & Learn

The nice thing in this guide is that it lists a lot of best practices, things to avoid, and gives meaningful examples. Although most of the recommendations sound fairly basic (It’s basic not trivial!) the hard part is actually doing them. I would never ever have expected that benefits and costs are not calculated cross agencies, or that someone is not considering a non-tech solution.

The impact of Puritan ideology on aspects of project management (Whitty & Schulz, 2007)

Mittwoch, August 13th, 2008

Puritan Ideology and Project Management

Whitty, Stephen Jonathan; Schulz, Mark Frederick: The impact of Puritan ideology on aspects of project management; in: International Journal of Project Management, Vol. 25 (2007), pp. 10–20.

This paper roots today’s prevalent ethics in Western project management to classical Puritanism. [Max Weber anyone?] Whitty & Schulz see the doctrinal supremacy, work ethic, and depravity of puritanism as a direct predecessor of today’s project management. They argue that the Purtianism descendants of Liberalism, Newtonianism, and Taylorism are another major influence.

The authors conclude with the remark: „Through no fault of their own, scholars and practitioners like are being driven by powerful memes that not only rive their behaviour but create the very fabric of their society. We owe it to ourselves to break free of the tyranny of these Puritan memes. But first, we must acknowledge that our past and present actions have been determined by them.“ (p. 18).

From Nobel Prize to Project Management – Getting Risks Right (Flyvbjerg, 2006)

Mittwoch, August 13th, 2008

Reference Class Forecasting

Flyvbjerg, Bent: From Nobel Prize to Project Management – Getting Risks Right; in: Journal of Project Management, Vol. 37 (2006), No. 3, pp. 5-15.

I was asked by some colleagues at work to look into reference class forecasting. Along with similarity based forecasting (which I know mostly form the work of Dan Lovallo) both techniques try to eliminate the various heuristics and biases projections of future values usually fall prey to, both methods try to bring an outside perspective into the forecast either by anchoring (similarity based) or by regression towards the mean (reference class).

Flyvbjerg proposes a 3-step approach. (1) Identify a relevant reference class of past, similar projects, (2) establish a probability distribution of the optimism bias for that class, and (3) compare the forecast at hand to the reference class.

The optimism bias is operationalised by populating the density function of historical cost overruns vs. initial budget. This function serves two purposes – framing the forecast with as much un-biased information as possible, and regressing the forecast to the mean. In order to do so, the author recommends to add an uplift to the estimate. The uplift is dependent on the risk the owner is willing to take and can be found by looking up the expected budget overrun for the percentile which corresponds to the risk/confidence level.

In this article Flyvbjerg shows his data on cost overrun distribution on Fixed Link, Roads and Rail projects. He also outlines the required uplifts and discusses first applications of this method.

[I tried to model the distribution for IT Software Development Projects, based on the only publicly available data I could find – the Standish Group’s Chaos Report. Although the data can be seen as flawed (see Jørgensen & Moløkken review of their first report), I modelled the density function anyway and derived the wonderful S-Curve y = e 0.0625–0.38689/x (with R²=99.8%). Following the method outlined in Flyvbjerg’s article the required uplift would be Uplift = 0.387/(0.063-ln(confidence level)), e.g., for 80% confidence the uplift needs to be 135.25% and for 50% confidence the uplift would be 51.18%.]

Understanding the Value of Project Management: First Steps on an International Investigation in Search of Value (Thomas & Mullaly, 2008)

Mittwoch, August 13th, 2008

Value of Project Management

Thomas, Janice; Mullaly, Mark: Understanding the Value of Project Management – First Steps on an International Investigation in Search of Value; in: Project Management Journal, Vol. 38 (2008), No. 3, pp. 74–89.

Thomas & Mullaly outline a conceptual model for investigating the value project management brings to an organisation. Their conceptual model assumes that three antecedents of value exist – (1) process criteria, (2) outcome criteria, and (3) fit of project management constructs with organisational context.

Furthermore they propose a 5 step evaluation of the value project management brings to the organisation in question

  1. Satisfaction – Is top management happy with project management?
  2. Aligned use of practices – Has project management implemented the processes it planned to do?
  3. Process outcomes – What process improvements have been achieved?
  4. Business outcomes – How did project management implementation impact business outcomes, e.g., customer satisfaction and retention, decreased time-to-market.
  5. ROI

[I am not sure about no. 2. This is quite a marketing/HR argument: ‚We can’t tell you if we achieved something, but we did, what we promised to do and we stayed in budget!‘. Still  I think that a better framework for the value created by project management is a value-oriented management approach.]

Motivation in Project Management – The Project Manager’s Perspective (Schmid & Adams, 2008)

Mittwoch, August 13th, 2008

Team Motivation on Projects - a Project Manager’s View

Schmid, Bernhard; Adams, Jonathan: Motivation in Project Management – The Project Manager’s Perspective; in: Project Management Journal, Vol. 39 (2008), No. 2, pp. 60–71.

What can a project manager do for the motivation of the project team? ‚A lot‘, say Schmid & Adams in this article. Among the powerful tools a project manager has are optimising energy, autonomy, feedback, and rewards & recognition. The authors find further that the most common factors lowering team motivation are the lack of top management support, personal conflicts on the team, and increases of the project scope. Schmid & Adams relate these factors to the project managers communication skills and thus to his/her ability to create a sub-culture under the organisational arch right from the beginning.

What should a project manager do to create intrinsic motivation? The authors conclude that the project manager should do three things – (1) involve the team early on, (2) understand the individual team members, and (3) motivate the team in the first stage of the project.

An Empirical Assessment of IT Project Selection and Evaluation Methods in State Government (Rosacker & Olson, 2008)

Mittwoch, August 13th, 2008

IT Project Selection Tools

Rosacker, Kirsten M.; Olson, David L.: An Empirical Assessment of IT Project Selection and Evaluation Methods in State Government; in: Project Management Journal, Vol. 39 (2008), No. 1, pp. 49–58.

Do project selection tools have an impact on project success? In order to answer this question Rosacker & Olson look into the usage of different quantitative and qualitative selection tools. As second step they try to link the tools to different success criteria.
Within their sample of 144 public IT projects (all in different U.S. states) the authors can only show limited correlations, using the F-Value [I don’t know about the distribution of the success variables, but if it isn’t normally distributed, the F-Test might have been to conservative and some effects which exist in real life, a classical example for the Type-2 Error or β-error].

  • NPV/IIR selected projects perform better in cost adherence
  • Projects selected based on ‚probability of completion‘ have a better overall performance
  • Projects selected due to ‚mandatory requirements‘ have a better overall performance
  • Projects selected with ’subjective assessment‘ perform better on their impact but perform weaker

Flexibility at Different Stages in the Life Cycle of Projects: An Empirical Illustration of the “Freedom o Maneuver“ (Olsson & Magnussen, 2007)

Dienstag, August 12th, 2008

Flexibility and Funding in Projects

Olsson, Nils O. E.; Magnussen, Ole M.: Flexibility at Different Stages in the Life Cycle of Projects: An Empirical Illustration of the “Freedom o Maneuver“; in: Journal of Project Management, Vol. 38 (2007), No. 4, pp. 25-32.

The conceptual model, that uncertainty and degrees of freedom decrease during the life cycle of a project whilst the actual costs increase, is nothing new. New is the empirical proof. Olsson & Magnussen are the first to measure the degrees of freedom. They use the governmentally required reduction lists as a measure for the degrees of freedom in public projects.

Moreover they recommend a funding system which gives the project manager control over the basic budget and the expected additional costs (e.g. the value of the risk register). On top of this funding go the reserves or contingencies, which typically are about 8% of the total budget and which are managed by the agencies. Then comes the reduction list, which usually is 5.9% of the budget in the beginning of the project and reduces to 0.8% at half time. The authors argue that such a funding system has 85% probability of being kept.

Best Project Management and Systems Engineering Practices in the Preacquisition Phase for Federal Intelligence and Defense Agencies (Meier, 2008)

Dienstag, August 12th, 2008

 Best Project Management and SE Practices

Meier, Steven R.: Best Project Management and Systems Engineering Practices in the Preacquisition Phase for Federal Intelligence and Defense Agencies; in Project Management Journal, Vol. 39 (2008), No. 1, pp. 59-71.

Scope Creep! Uncontrolled growth in programs, especially public acquisitions is nothing new. [I highly suspect that we only look down on public projects because private companies are much better in hiding their failures.] Meier analyses the root causes for scope creep in intelligence and defense projects and proposes counter actions to be taken.

The root causes for creeping scope are

  • overzealous advocacy
  • immature technology
  • lack of corporate technology road maps
  • requirements instability
  • ineffective acquisition strategies, i.e. no incentives to stick to the budget
  • unrealistic baselines and a high reliance on contractor baselines
  • inadequate systems engineering, e.g. no concept of operations, system requirements document, statement of work, request for proposal, contact data requirements list
  • workforce issues, e.g. high staff turnover, no PMO

Meier’s remedies for this predicament are quite obvious. Have a devil’s inquisitor or a third party review to get rid of the optimism bias. Wait until technology maturity is achieved or factor in higher contingencies. Set investment priorities. Put incentives into the contracts. Estimate own costs prior to RfP. Follow systems engineering standards, e.g. INCOSE’s. Manage your workforce.

Public-Private Partnership – Elements for a Project-Based Management Typology (Mazouz et al., 2008)

Dienstag, August 12th, 2008

 PPP Typology

Mazouz, Bachir; Facal, Joseph; Viola, Jean-Michel: Public-Private Partnership – Elements for a Project-Based Management Typology; in: Journal of Project Management, Vol. 39 (2008), No. 2, pp. 98-110.

In this article Mazouz et al. develop a typology for public-private-partnerships. They span a matrix along the two dimensions of proximity of target and capacity to generate projects. The proximity „refers to the position of the public organisation in relation to its target clientèle“.

  1. Situational Partnership (close distant, high capacity)
  2. Symbiotic Partnership (close distant, low capacity)
  3. Elementary Partnership (high distance, high capacity)
  4. Forward-looking Partnership (high distance, low capacity)

As the authors further point out a forward-looking partnership is most difficult to manage. This type is characterized by the public company being far away from my usual client base and a low capacity to generate future projects out of this PPP.
To manage these challenges Mazouz et al. recommend two distinct types of PPPs – contractual and relational PPP. A contractual PPP is best suited for well defined, measurable projects, based on management systems; whereas a relational PPP is best when tasks are continuously re-defined, the outcome is ambiguous, and the project is based on individuals.

Motivation: How to Increase Project Team Performance (Peterson, 2007)

Dienstag, August 12th, 2008

Motivational mistakes and how to overcome them

Peterson, Tonya M.: Motivation – How to Increase Project Team Performance; in: Project Management Journal, Vol. 38 (2007), No. 4, pp. 60-69.

Peterson explores the big DON’Ts of team motivation. Motivation she argues is best explained by five theories (1) Theory X, (2) Theory Y, (3) Herzberg’s KITA, (4) McClelland’s need for achievement, and (5) MBTI. Peterson then continues to outline the 8 DON’Ts of team motivation and what can be done to correct them

  • Whatever motivates me, will motivate others
  • People are primarily motivated by money
  • Team members love to receive formal awards
  • Give them a rally slogan
  • The best leader is a strong cheerleader
  • These people are professionals, they don’t need motivation
  • I’ll motivate them when there is a problem
  • I’ll treat everyone the same – people like that and it will motivate them

The remedies to all these points boil down to a couple of points

  • Do not withdraw from the team, involve yourself, guide, support the team
  • Acknowledge that people are different (from you and each other)
  • Leadership is about mentoring and individual problem solving

Information Systems Project Management Decision Making – The Influence of Experience and Risk Propensity (Huff & Prybutok, 2008)

Dienstag, August 12th, 2008

Decision Making on IS Projects

Huff, Richard A.; Prybutok, Victor R.: Information Systems Project Management Decision Making – The Influence of Experience and Risk Propensity; in: Journal of Project Management, Vol. 39 (2008), No. 2, pp. 34-47.

Huff & Prybutok analyse the antecedents of decision making of project managers in IT projects. Their hypothesis includes that knowledge and risk behaviour have an impact on decision-making. In both cases that can be empirically proven. Although knowledge is mostly driven by project management experience, whereas work experience has no influence on making decisions. The risk behaviour can be explained by the risk propensity, which are the „perceived psychological/emotional costs of the decision“.
In short this means continuation decisions (which were the subject of this research) are influenced by the managers project management experience and by his/her risk propensity.