Archive for September 22nd, 2008

Leadership for future construction industry – Agenda for authentic leadership (Toor & Ofori, 2008)

Montag, September 22nd, 2008

 Leadership for future construction industry

Toor, Shamas-ur-Rehman; Ofori, George: Leadership for future construction industry – Agenda for authentic leadership; in: International Journal of Project Management, in press (2008).

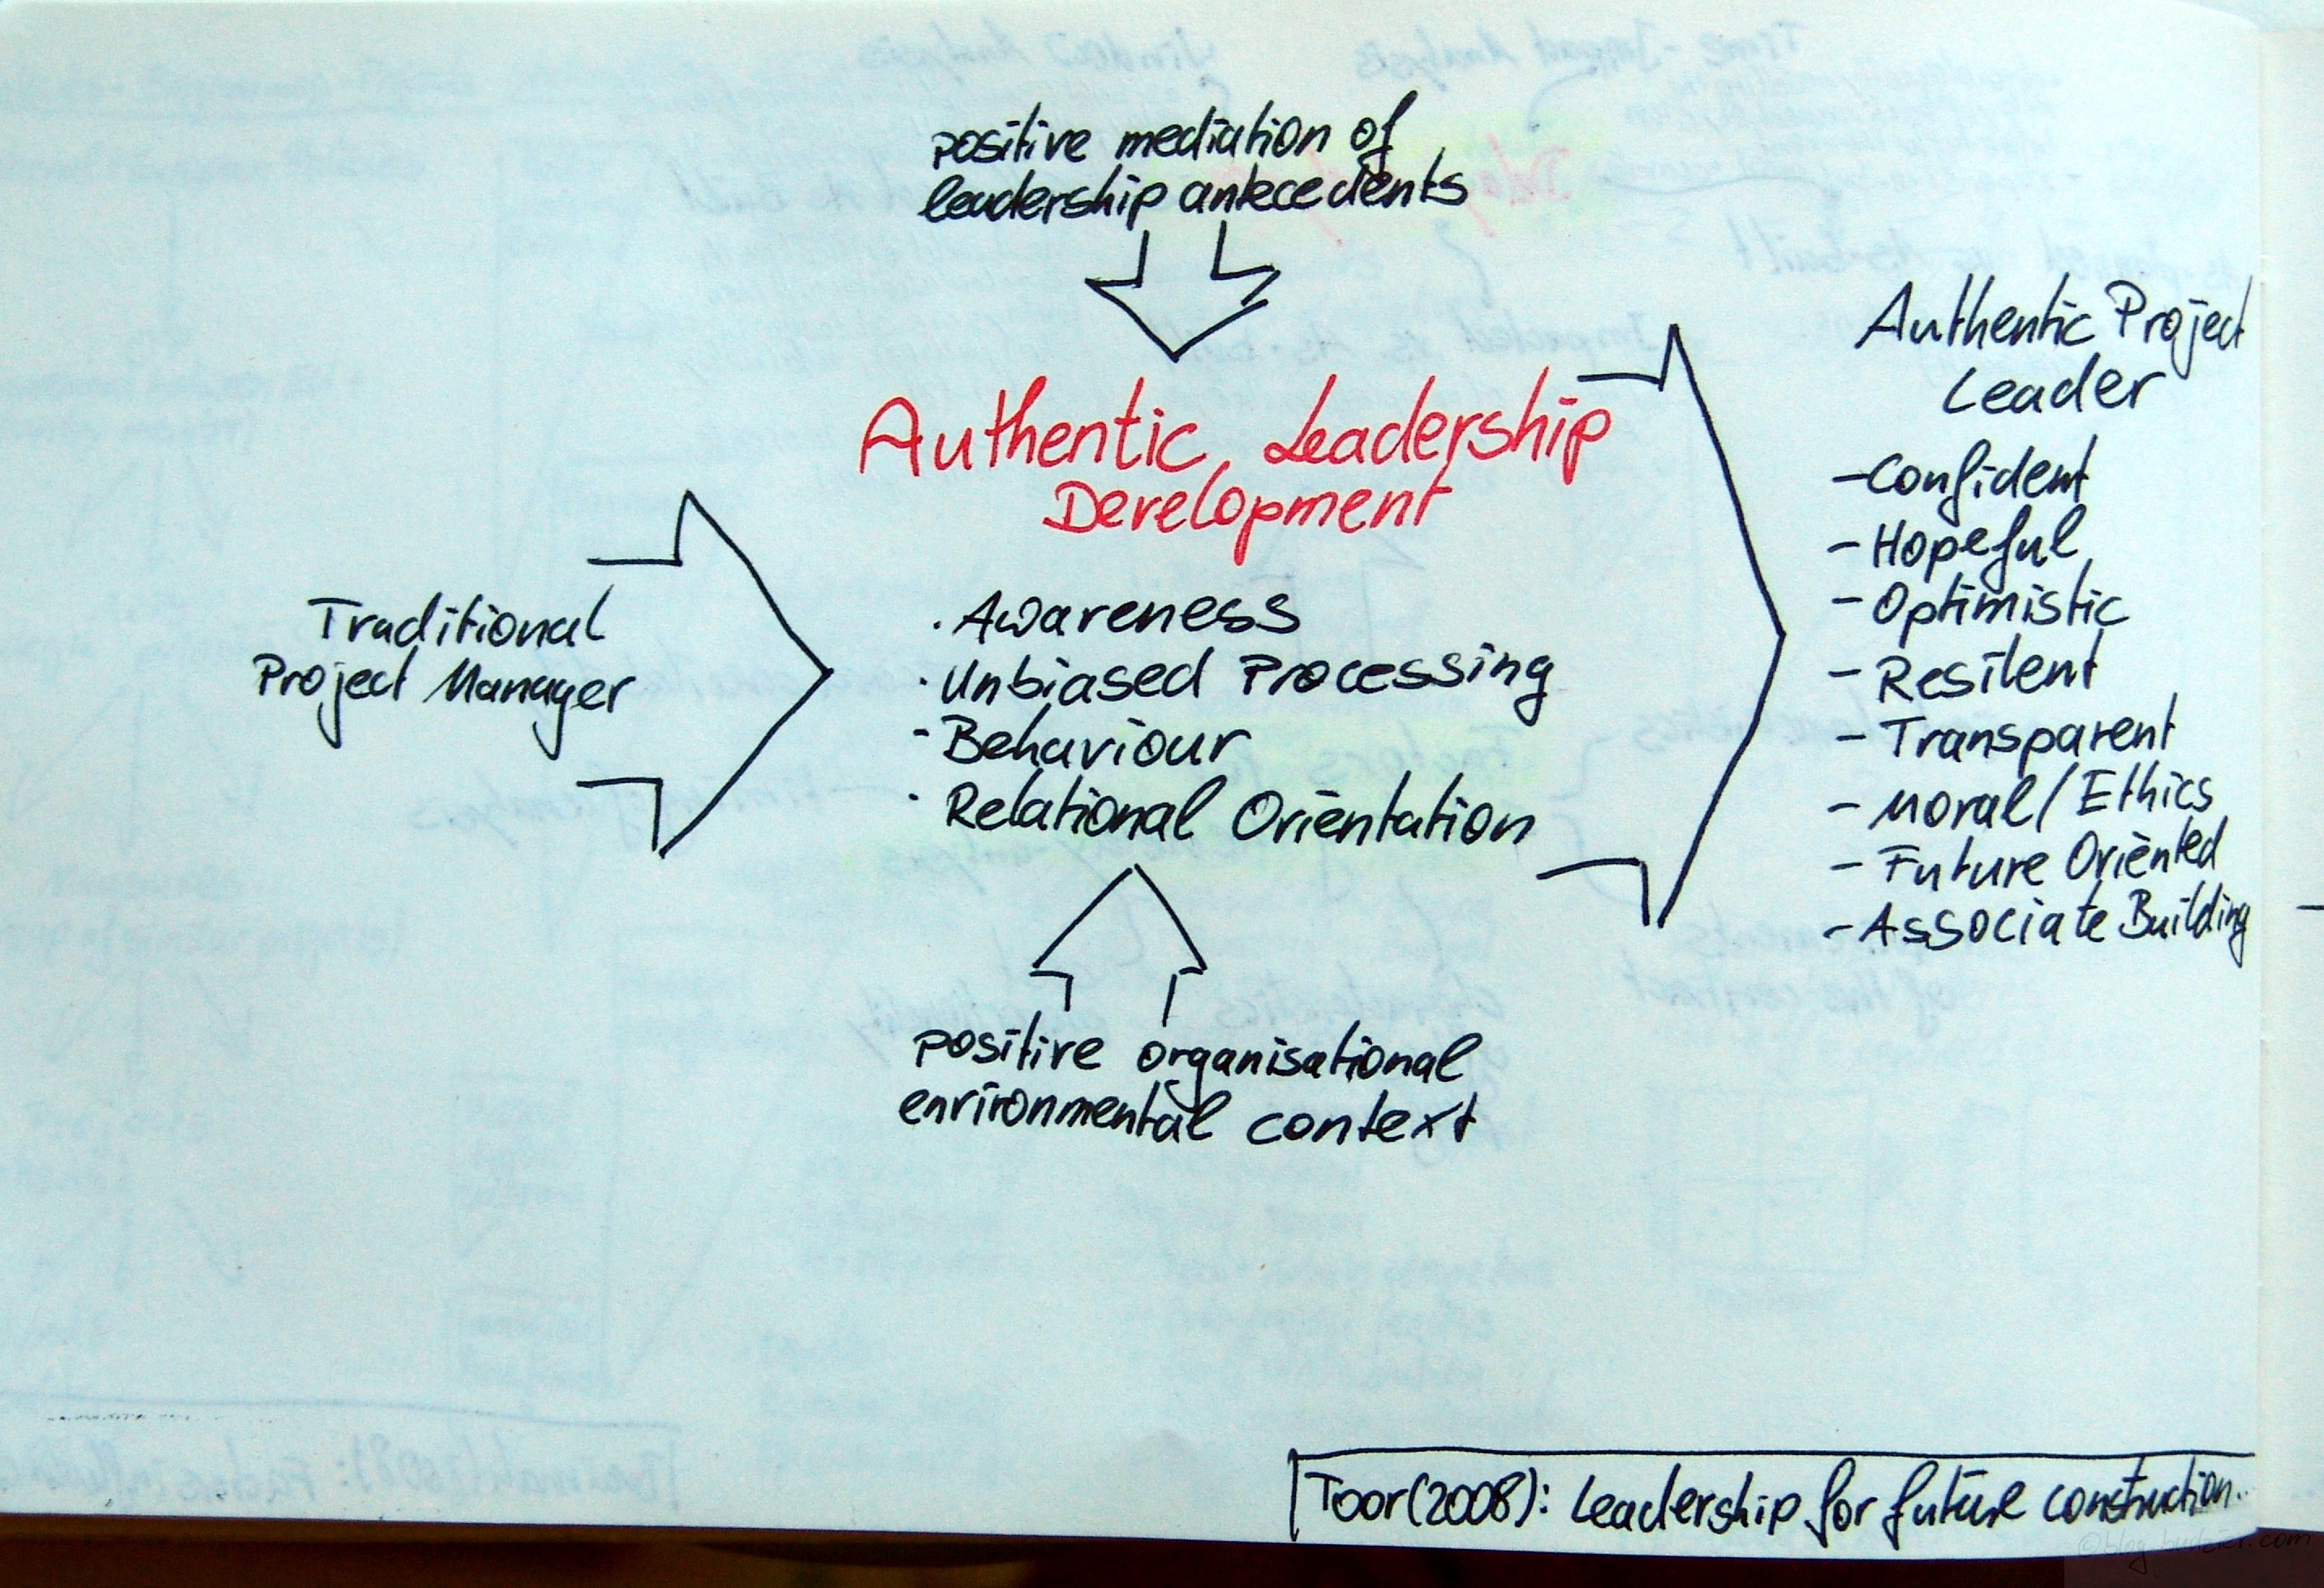
Ever since Bill George popularized the meme „authentic leadership“ more and more articles pop up investigating this concept. In George’s words ‚authentic leadership‘ is simply just being yourself. Leadership is authenticity, not style! This includes building your own leadership style, adapting it to different situations, but also realising which weaknesses you have. Enough said – a summary can be found here.

Toor & Ofori look into the authentic leadership concept and root the ’new‘ way of leading on three antecedents – (1) image/style of the traditional project manager, (2) postitive mediation of leadership antecedents, and (3) positive environmental context. Thus allowing the authentic leader to develop, where leaders achieve awareness, can process unbiased, showthe distinct/authentic behaviour, and develop a relational orientation.
In Toor & Ofori’s article such a developmental process leads to an authentic leader who is characterised by

  • Confidence
  • Hopefulness
  • Optimism
  • Resilience
  • Transparency
  • Moral/Ethics
  • Future orientation
  • Associate building

Factors influencing the selection of delay analysis methodologies (Braimah & Ndekugri, 2008)

Montag, September 22nd, 2008

 Delay analysis

Braimah, Nuhu; Ndekugri, Issaka: Factors influencing the selection of delay analysis methodologies; in: International Journal of Project Management, in press (2008).

Delay analysis. What a great tool. Whoever fought a claim with a vendor, might appreciate this. Braimah & Ndekugri analysed the factors influencing the decision which delay-analysis to use. Their study was done in the construction industry where delay analysis is a common tool in claims handling. [On the other side, I have not seen a delay analysis done for a fight with a vendor on an IT project. There is so many things we can learn.]

The authors identify 5 different types of delay analysis.
(1) Time-impact analysis – the critical event technique – modelling the critical path before and after each event
(2) As-planned vs. as-built comparison – the shortcut – compare these two projections, don’t change the critical path, might skew the impact of the event if work wasn’t going to plan previously
(3) Impacted vs. as-built comparison  – the bottom-line – analyse the new date of completion, but no changes to critical path
(4) Collapsed vs. as-built comparison – the cumbersome – first an as-built critical path is calculated retrospectively (this is tricky and cumbersome), secondly all delays are set to zero = collapsing. The difference between these two completion dates is the total delay.
(5) Window analysis – the best of all worlds – the critical path is split into timeframes and only partial as-built critical paths are modelled. The total delay is the total delay of windows impacted by the event in question. Good way to break-down complexity and dynamics into manageable chunks.

In the second part [which I found less interessting, but on the other hand I never touched this interesting analytical subject of delay-analysis before] the authors explore the factors influencing the delay analysis used. The factors found are

  • Project characteristics
  • Requirements of the contract
  • Characteristics of the baseline programme
  • Cost proportionality
  • Timing of analysis
  • Record availability

A multicriteria satisfaction analysis approach in the assessment of operational programmes (Ipsilandis et al., 2008)

Montag, September 22nd, 2008

A multicriteria satisfaction analysis approach in the assessment of operational programmes (Ipsilandis et al., 2008)

Ipsilandis, Pandelis G.; Samaras, George; Mplanas, Nikolaos: A multicriteria satisfaction analysis approach in the assessment of operational programmes; in: International Journal of Project Management, Vol. 26 (2008), No. 6, pp. 601-611.
http://dx.doi.org/10.1016/j.ijproman.2007.09.003

Satisfaction measurement was one of my big things for a long time, when I was still working in market research. I still believe in the managerial power of satisfaction measurements, although you might not want to do it every 8 weeks rolling. Well, that’s another story and one of these projects where a lot of data is gathered for no specific decision-making purpose and therefore the data only sees limited use.

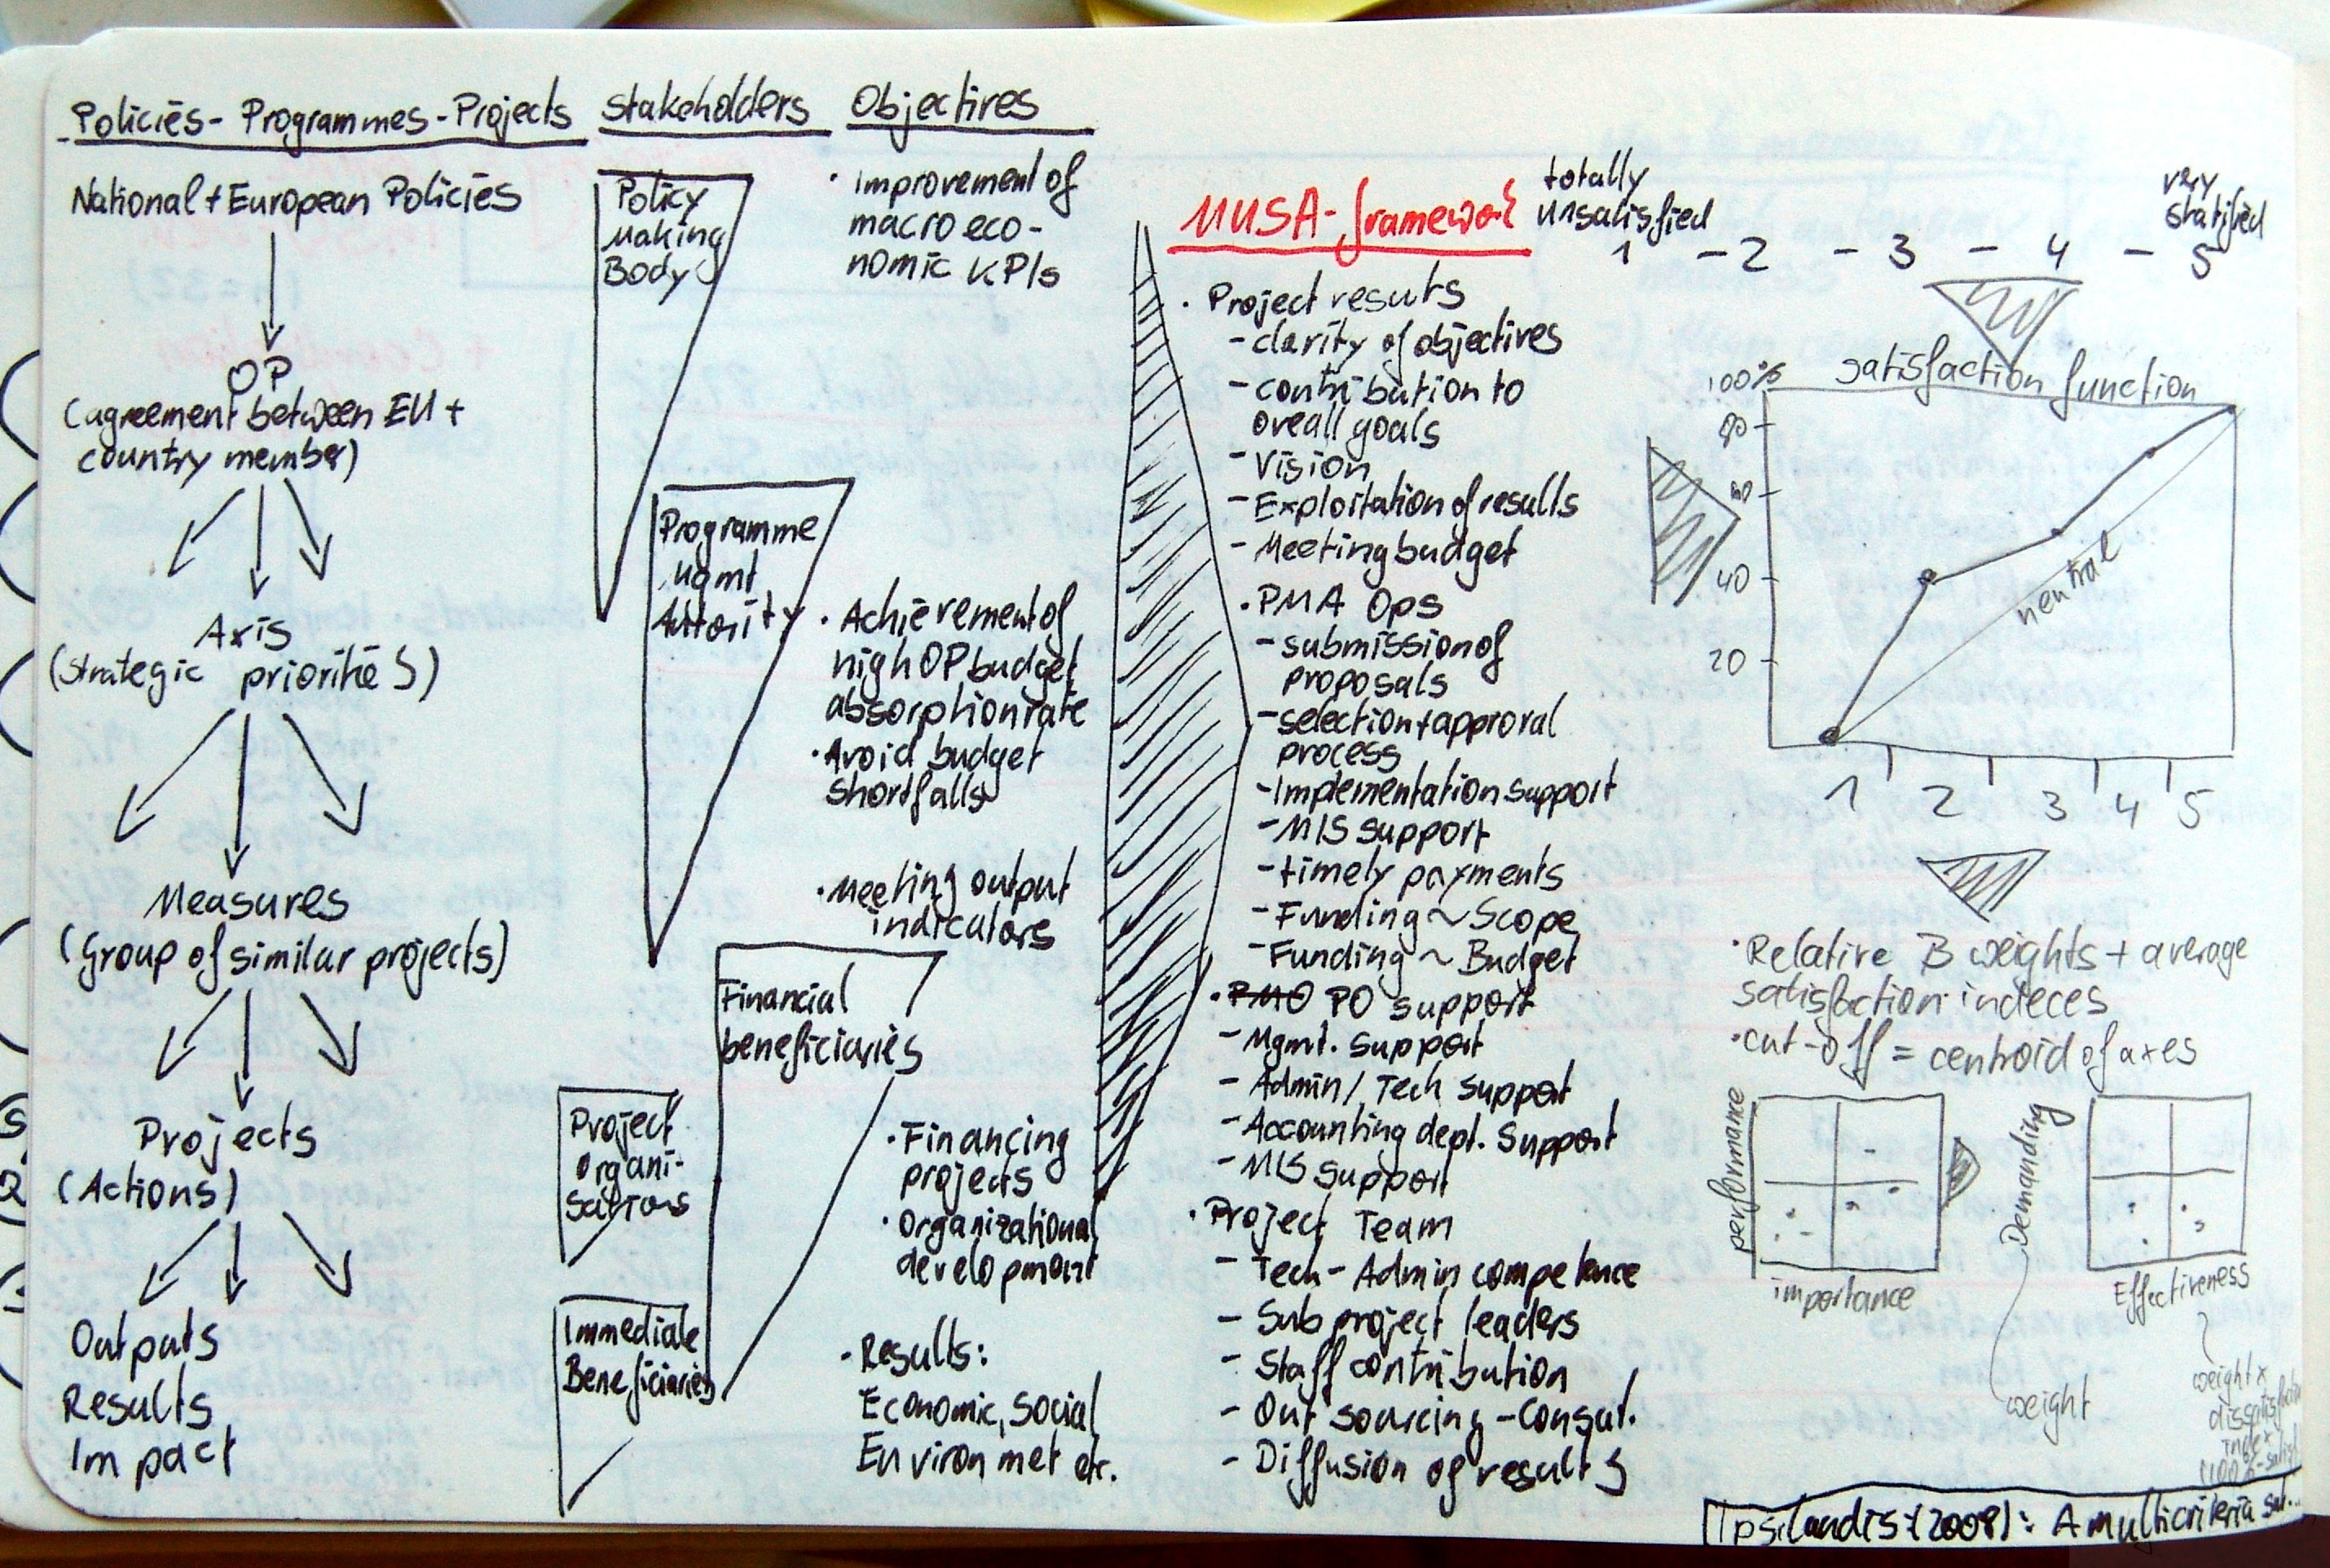
Anyway, Ipsilandis et al. design a tool to measure project/programme satisfaction for European Union programmes. First of all they give a short overview (for all the non-knowing) into the chain of actions at the EU. On top of that chain sit the national/european policies, which become operational programmes (by agreement between the EU and national bodies). Programmes consists of several main lines of actions called axis, which are also understood as strategic priorities. The axis are further subdevided into measures, which are groups of similar projects or sub-programmes. The measures itself contain the single projects, where the real actions take place and outputs, results, and impact is achieved. [I always thought that just having a single program management body sitting on top of projects can lead to questionable overhead.]

Ipsilandis et al. further identify the main stakeholders for each of the chain of policies –> projects. The five stakeholders are – policy making bodies, programme management authority, financial beneficiaries, project organisations, immediate beneficiaries. The authors go on to identify the objectives for each of these stakeholder groups. Then Ipsilandis et al. propose a MUSA framework (multi criteria satisfaction analysis) in which they measure satisfaction (on a five point scale, where 1=totally unsatisfied, and 5=very satisfied)

  • Project results
    • Clarity of objectives
    • Contribution to overall goals
    • Vision
    • Exploitation of results
    • Meeting budget
  • Project management authority operations
    • Submission of proposals
    • Selection and approval process
    • Implementation support
    • MIS support
    • Timely payments
    • Funding ~ Scope
    • Funding ~ Budget
  • Project Office support
    • Management support
    • Admin/tech support
    • Accounting dept. support
    • MIS support
  • Project Team
    • Tech/admin competence
    • Subproject leader
    • Staff contribution
    • Outsourcing/consultants
    • Diffusion of results

The authors then run through a sample report, which contains the typical representations of satisfaction scores, but they have 3 noteworthy ideas – (1) the satisfaction function, (2) performance x importance matrix, and (3) demanding x effectiveness matrix. The satisfaction function is simply the distribution function of satisfaction scores.
[I still do not understand why the line between 0% at score 1 and 100% at score 5 should represent neutrality – Such a line would assume uniform distribution of scores, where I think normal distribution is more often the case, which is also acknowledged by the authors, when they try to establish beta-weights via regression analysis, where normality is a pre-requisite for.]

Furthermore Ipsilandis et al. continue to establish the relative beta-weights for each item and calculate the average satisfaction index accordingly (satisfaction is indexed at 0% to 100%). Cutting-off at the centroid on each axis they span a 2×2 matrix for importance (beta-weight) vs. performance (satisfaction index). The authors call these diagrams „Action diagrams“.
[Centroid of the axis is just a cool way of referring to the mean.]

The third set of diagrams, the so called „Improvement diagrams“, are demanding vs. effectiveness matrices. The demanding dimension is defined by the beta-weights once more. The rational behind this thinking is, that a similar improvement leads to higher satisfaction at items with a higher beta-weight. The effectiveness dimension is the weighted dissatisfaction index. Simply put it is beta-weight*(100%-satisfaction index %). Reasoning behind this is to identify the actions with a great marginal contribution to overall satisfaction and only little effort needed.
[I still don’t understand why this diagram is needed, since the same message is conveyed in the ‚action diagrams‘ – anyway, a different way of showing it. Same, same but different.
What I previously tried to fiddle around with are log-transformations, e.g. logit, to model satisfaction indeces and their development in a non-linear fashion, instead of just weighting and normalising them. Such a procedure would put more importance on very low and very high values, following the reasoning, that fixing something completely broken is a big deal, whereas perfecting the almost perfect (think choosing the right lipstick for Scarlett Johannson) is not such a wise way to spend your time and money (fans of Ms. Johannson might disagree).]
The mechanisms of project management of software development (McBride, 2008)

Montag, September 22nd, 2008

The mechanisms of project management of software development

McBride, Tom: The mechanisms of project management of software development; in: Journal of Systems and Software, Article in Press.
http://dx.doi.org/10.1016/j.jss.2008.06.015

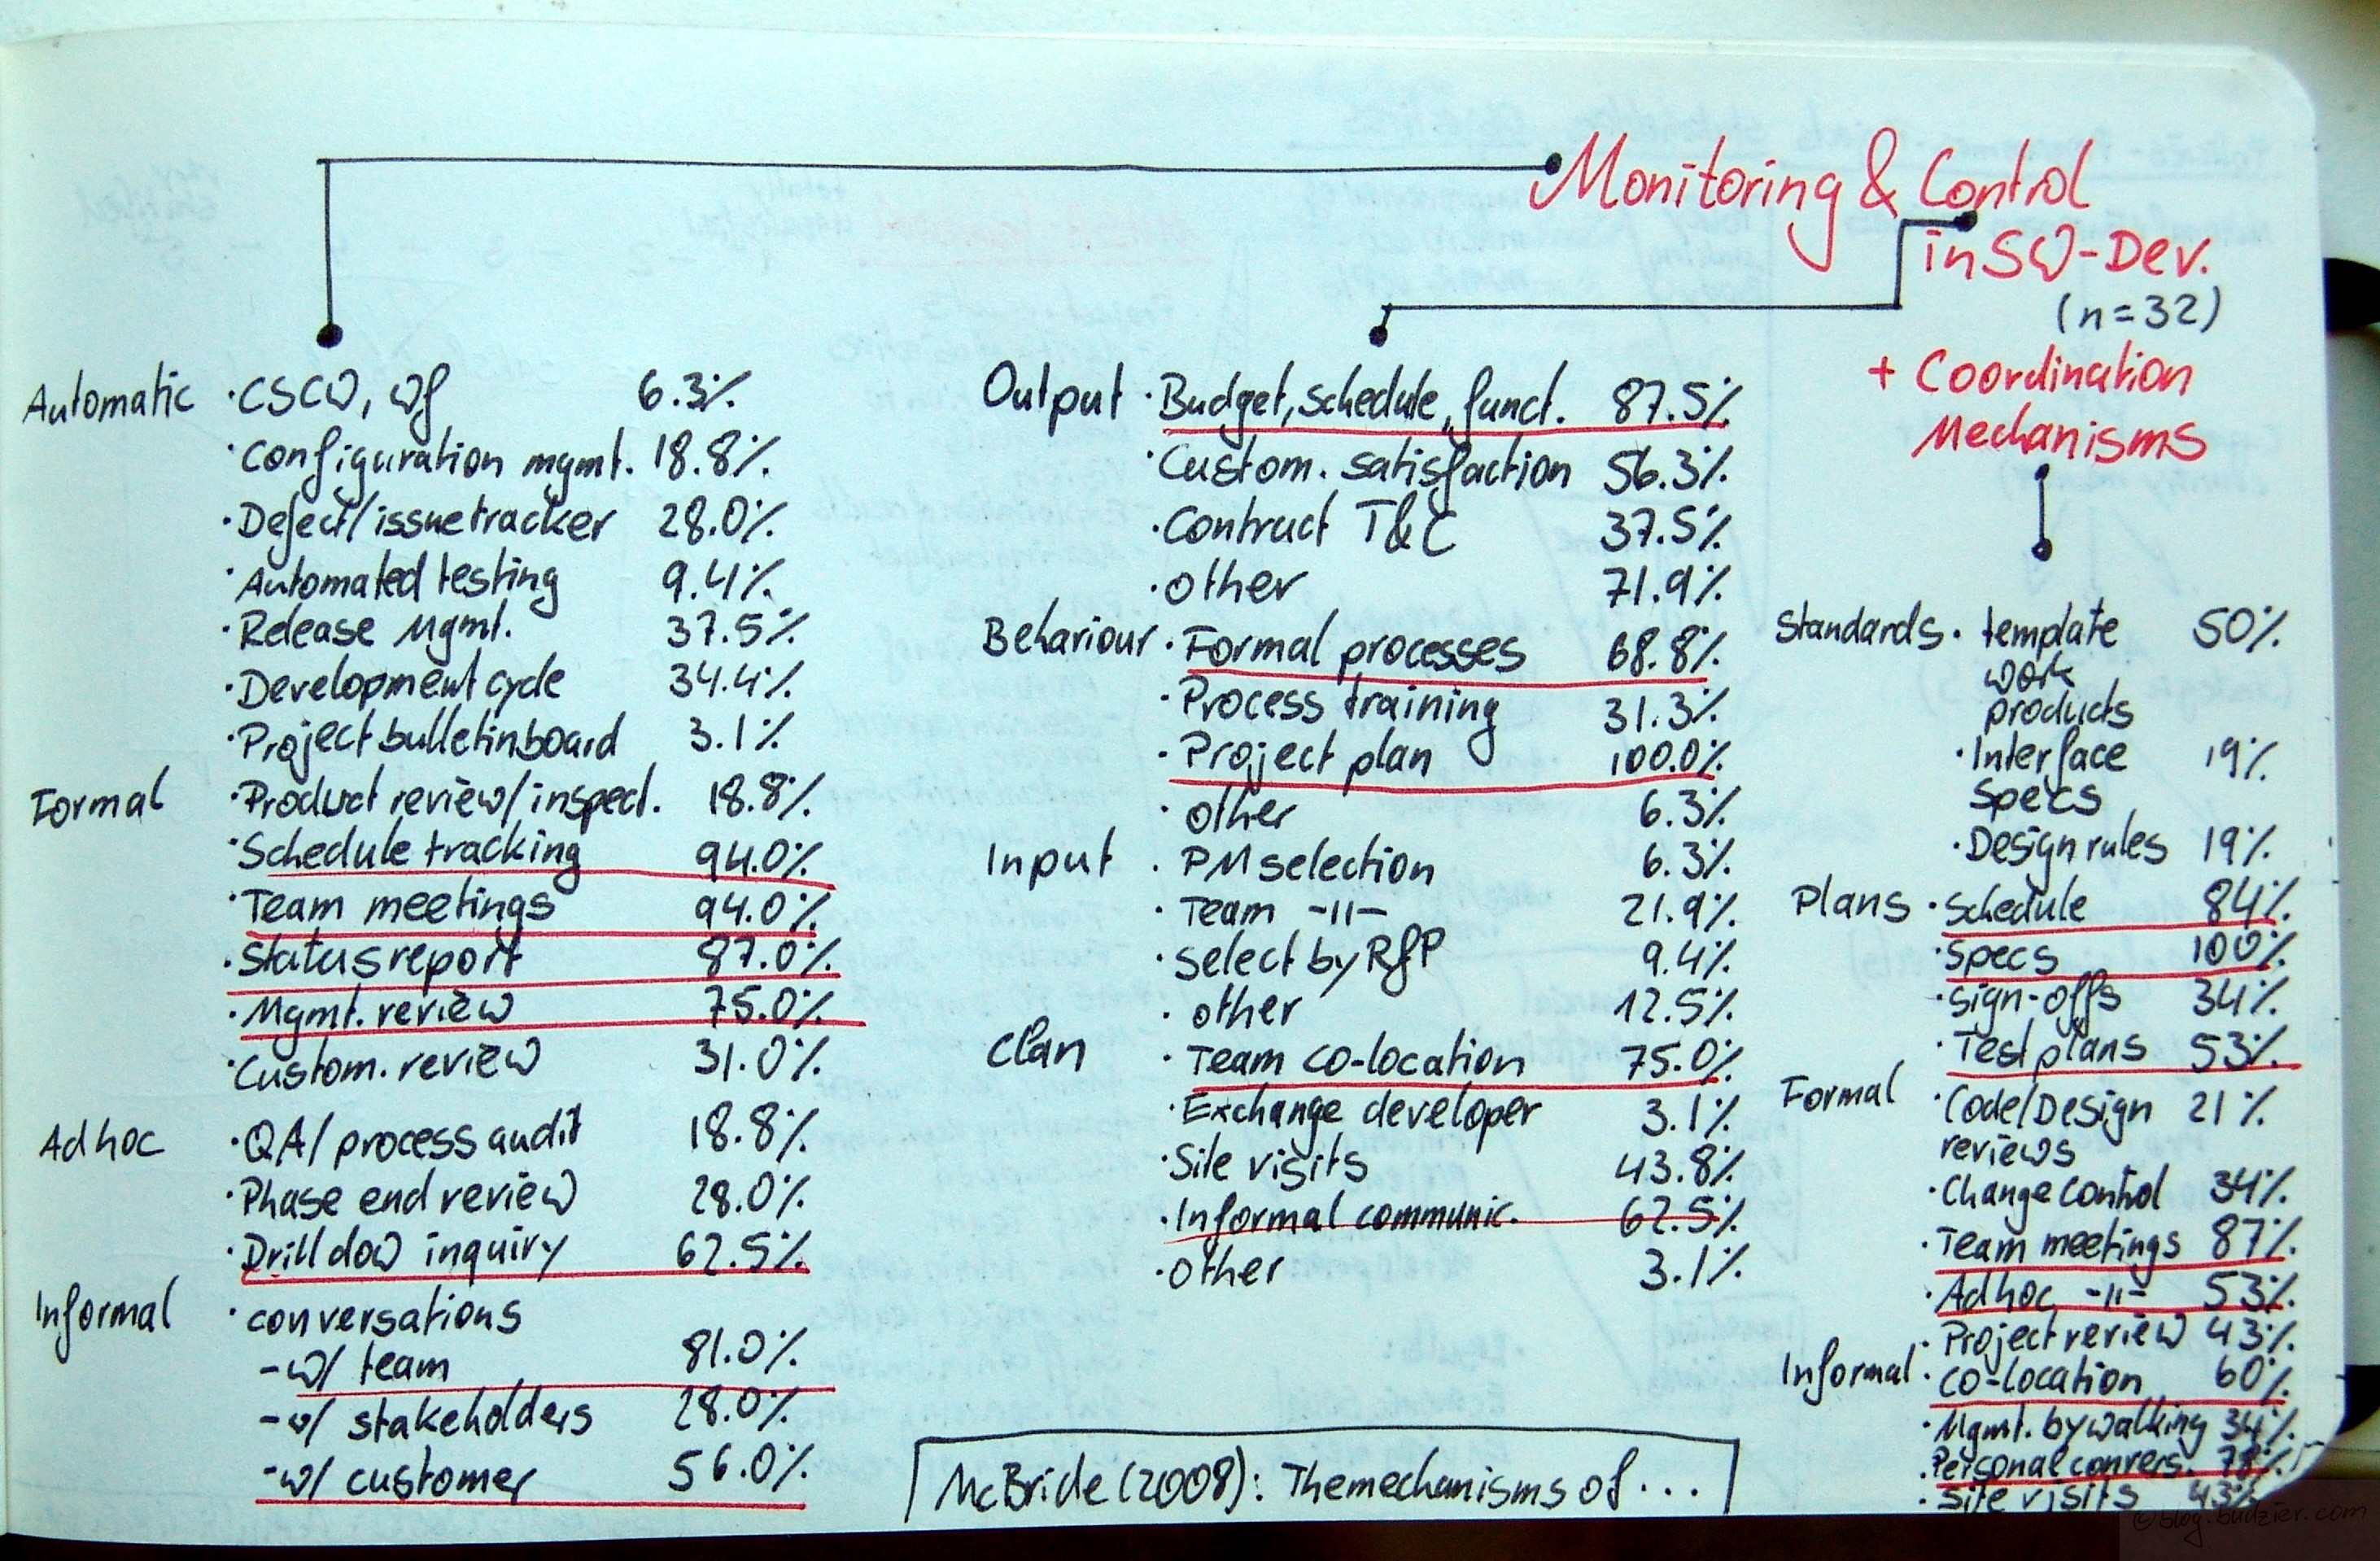
McBride covers two aspects of tools and techniques for the management of software developments. Firstly the monitoring, secondly the control and thirdly the coordination mechanisms used in software development.

The author distinguishes four categories of monitoring tools: automatic, formal, ad hoc, and informal. The most common tools used are schedule tracking, team meeting, status report, management reviews, drill downs, conversations with the team and the customers.

The control mechanisms are categorised by their organisational form of control as either output, behaviour, input, or clan control. The most often used control mechanisms are Budget/schedule/functionality control, formal processes, project plan, team co-location, and informal communities.

Lastly the Coordination mechanisms are grouped by which way the try to coordinate the teams: standards, plans, formal and informal coordination mechanisms. The most common are specifications, schedule, test plans, team meetings, ad hoc meetings, co-location, and personal conversations.